Cannabis has seen a huge increase this year as President Joseph Biden's administration took office.
Though it is not completely clear if the Federal government will push for widespread legalization, its last bill to further decriminalize cannabis makes it easier for states to push their own legalization agendas. With 11 states making it available for recreational use, the trend has a lot more room to grow.
More importantly the cannabis space has come off its highs and is now consolidating over a major moving average.
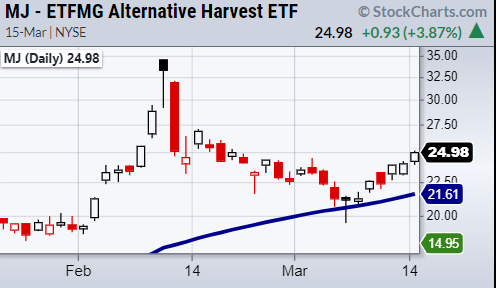
The above chart shows ETFMG Alternative Harvest (NYSE:MJ) which holds both U.S. and Canadian companies.
Back in late February, it put in highs around $34 and from then proceeded to have a 40% plus correction down to the $19 area. While this is a decent pullback, MJ never closed underneath its 50-day moving average.
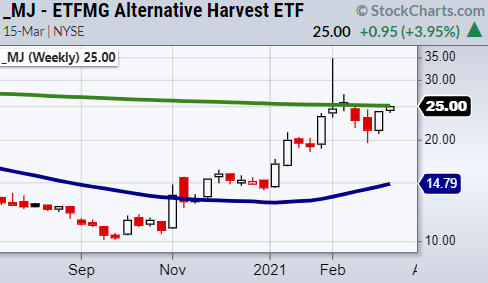
From a technical standpoint this looks good as the brief dip under the 50-DMA was never revisited. The only caveat is found on the weekly chart.

The 200-weekly moving average (Green line) is currently at 25.10. This is a pivotal level for price to clear or fail today.
If this price level can’t be cleared, it may take more time and consolidation between the 50-DMA and the 200-WMA before the move upwards is ready.
Luckily, the momentum is leaning in a break of resistance as the both the 50 and 200 daily moving averages are sloping up.
- S&P 500 (SPY) New highs.
- Russell 2000 (IWM) New highs. Like to see 230 as new support.
- Dow (DIA) New Highs. 320 new support.
- NASDAQ (QQQ) Main resistance 320 the 50-DMA.
- KRE (Regional Banks) 68.24 support area.
- SMH (Semiconductors) 236.71 resistance.
- IYT (Transportation) New highs.
- IBB (Biotechnology) Main resistance 160.34 the 50-DMA.
- XRT (Retail) 93.48 pivotal area.
- Volatility Index (VXX) Watching to find support.
- Junk Bonds (JNK) More sideways price action. 107.18 200-WMA support.
- LQD (iShares iBoxx $ Investment Grade Corp Bond ETF) 132 resistance. 128.53 Recent low.
- IYR (Real Estate) New multi month high.
- XLU (Utilities) Confirmed bullish phase with second close over 50-DMA at 61.84
- GLD (Gold Trust) Doji day.
- SLV (Silver) Like to see this push toward the 50-DMA at 24.56.
- VBK (Small Cap Growth ETF) Needs second closer over 50-DMA at 283.54.
- UGA (US Gas Fund) 32.96 support the 10-DMA.
- TLT (iShares 20+ Year Treasuries) If holds, needs to fill gap to 138.46.
- USD (Dollar) Doji day.
- EZA (South Africa) Bounced off the 10-DMA 48.51.
- EWW (Mexico) 40.72 support. Coming into resistance from January.
- MJ (Alternative Harvest ETF) 25.10 needs to clear.
- WEAT (Teucrium Wheat Fund) Broke support 6.15 but closed back over.
