* Natural Gas to enter a multi-year bull market
* Price is projected to double within the next 12-18 months
* Is Global Cooling really a thing?
Have you ever seen price do something so counterintuitive in the face of opposing fundamental data you’re left dumbstruck? Sure, we all have. I recently wrote an article about crude oil and after the most bearish inventory report of the 2016-2017 season, price immediately rallied. (Say What?) Believe it not, there are countless examples of this happening within every market in which there is seemingly no practical fundamental answer. Traders tend to become frustrated and dig in their heels awaiting the imminent reversal that never materializes within their timeframe. The cliché, I’d rather be rich than right, applies here.
As a technical trader who primarily applies R.N. Elliott’s wave principles to forecast price for trading profit, I subscribe to the notion that the fundamental data tends to lag the market. Does anyone know a trader who uses a lagging indicator to successfully trade for profit? I don’t. That’s because the sentiment of traders who are involved on a daily basis dictate price movement.
I believe natural gas is about to begin a multi-year bull market cycle. Since I believe fundamental data lags price movement. I have included an abridged version of what Robert Prechter writes in his 1979 book, “The Elliott Wave Principle” about fundamentals and trend changes.
When the first wave of a new bull market begins it is rarely obvious. The fundamental news is almost universally negative. The previous trend is considered still strongly in force, and fundamental analysts continue to revise their outlooks lower.
Last month I authored my perspective on the natural gas trend change and some the comments I received were interesting. One reader wrote, “Curious why the author would forecast natural gas to rally during the summer months”. Another wrote, “Great! Another wave guy. I’m gonna kill myself”. According to Prechter, if in fact Natural Gas is set up to change trend, these types of comments are to be expected.
So let’s examine why I believe natural gas has changed trend.
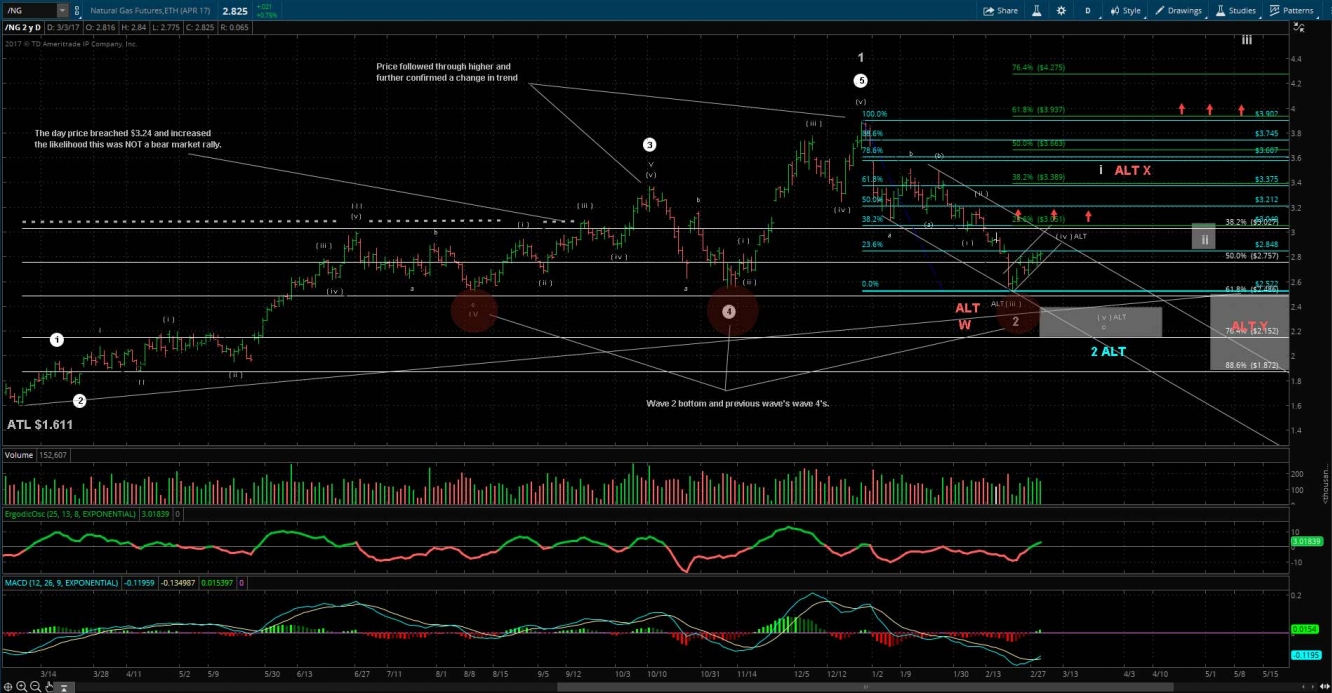
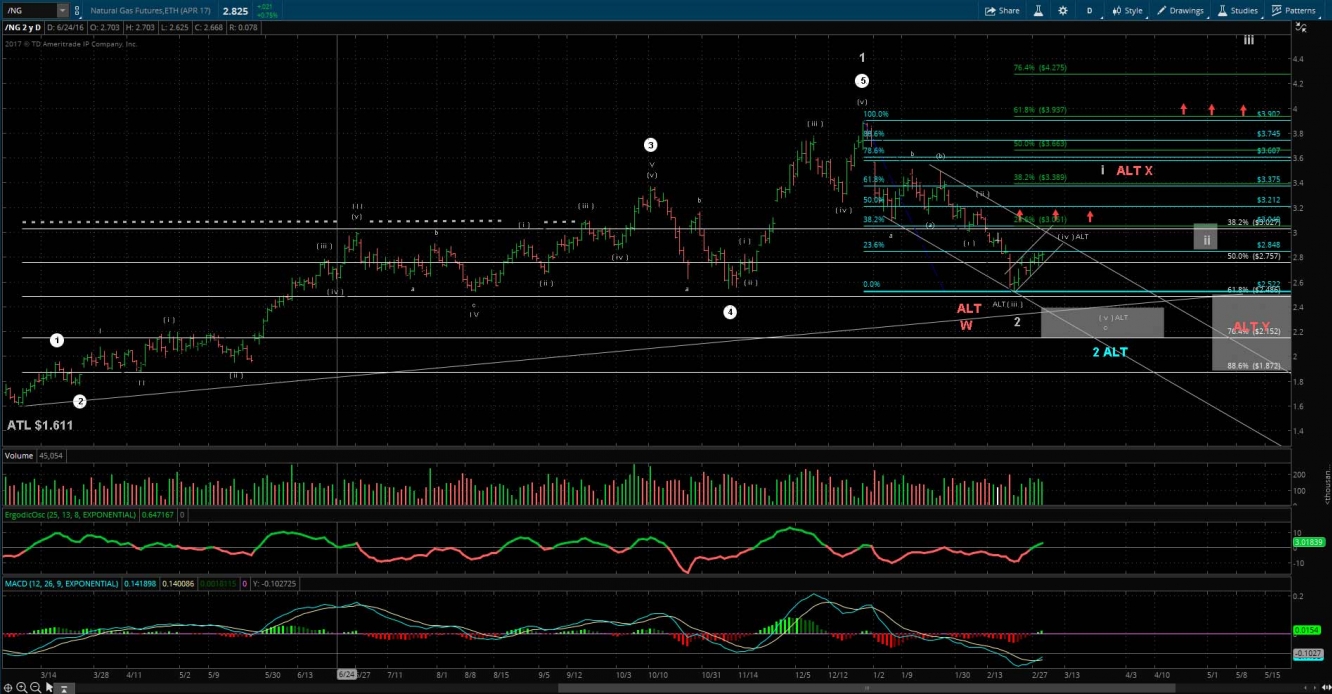
The below daily chart of natural gas shows we recently have completed wave 1 and wave 2. Currently this is my preferred path for price. I have noted two alternative wave counts that shows wave 2 is in an ending diagonal with one more minor low to come(notated in blue), or a final alternative (least probable red count) will take a much longer time to resolve itself.
In the chart below, we can count a completed 5-wave pattern (white circles 1-5). That completed intermediate term wave 1. We know with a high probability of certainty that this rally was in fact a trend changer. In "The Elliott Wave Principle", Prechter established clear rules and guidelines for the proper application of Elliott’s work. One guideline in particular is a corrective wave 4 should not exceed the .50% level of the prior wave 3. When this takes place, it increases the odds dramatically the wave 4 count is incorrect. In short, on 10/10/2016, the rally off the all-time low could no longer be considered high probability it was a corrective rally within an overall bear market structure. To further confirm this, price continued to advance ultimately to $3.902 into 12/28/2016. Additional guidelines for a wave 2 bottom is in the area of the previous wave’s wave 4 (highlighted in red circles). According to the rules and guidelines of Elliott Wave Theory, this could be considered a textbook bottom and retracement with the strongest portion of the reversal ahead.
Therefore we should turn our analytical attention to forecasting the potential pathway this trend change in natural gas will take.
See below chart showing a completed wave 1 and 2. The decline from $3.902 was stopped in the area of the previous wave’s 4. 
For higher resolution: (Right click on image and select Open Image in New Tab)
Preferred Path (Highest Probability Noted in White):

For higher resolution: (Right click on image and select Open Image in New Tab)
For the preferred path to be validated, price must now trade to the area $3.37-$3.39 and at no time can it breach $3.522. For further validation, price should then correctively retrace into the area of $2.75-$3.02 and then proceed to trade through the $3.37-$3.39 area in an impulsive fashion. For final confirmation the preferred path is correct, once price trades above the $3.37-3.39 area, it should breach the previous swing high of $3.902 for a minor wave (iii) of intermediate wave 3. I will expand upon my preferred pathway in future articles once we have price confirmation.
Alternative Paths:
Blue path suggests that although natural gas has a confirmed trend changing bottom in place, wave 2 has a little work to do before considered complete. The smaller count places wave 2 in an ending diagonal wave (iv) with one more minor low to come into the $2.30-$2.40.
Red path consists of a complex WXY pattern playing out in which price still rallies into the mid $3 dollar range, but subsequently will bottom in the area of $2.50 to $1.87.
All of the various paths I outlined are perfectly accepted within Elliott Wave Principle. Each day price gives us more clues to the overall puzzle of the manner in which in plans to enter this long-term bull market.
Conclusion: Is Global Cooling Really a Thing?
I have no empirical evidence that planet earth is about to embark on some global cooling weather anomaly. However, if my preferred path is confirmed, then price means to advance during the summer months. Once again, this would be one of those counterintuitive events I mentioned in the beginning. If price does advance during summer I simply cannot rule out that we may encounter some kind of “The Day After Tomorrow” scenario. Side bar: Great Dennis Quaid movie. If you trade natural gas you may want to check this movie out.
As ridiculous as global cooling is so will those fundamental explanations for the higher price in natural gas during this summer.
