* US is back to producing 9M bpd
* OPEC has largely complied with agreed to production cuts
* Oil is up 107% from its February 2016 low
I am a technical trader. However the dichotomy of fundamentals and market prices has fascinated me for a long time. On one hand, to say the underlying fundamental strength or weakness in any particular commodity is of no value to a trader seems illogical. On the other hand, the anecdotal information is pretty clear that in the short term that it’s perfectly reasonable to ignore these data points. This was never clearer to me than on February 8th in the oil futures market.
Let me explain.
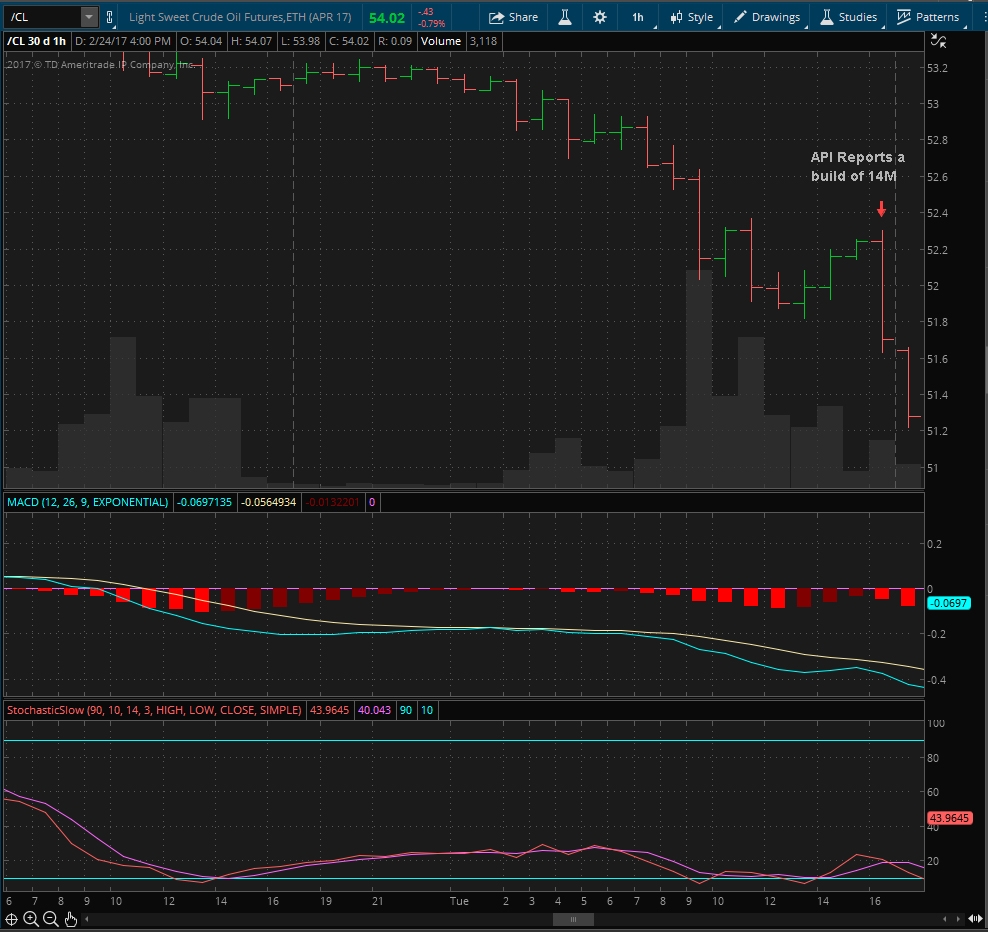
The evening before the official EIA government report on oil inventories on 8th, API, a competing oil market survey report, releases its unofficial weekly oil inventory report. There tends to be wide variances between the unofficial API and the official government EIA report. API comes out the night before the government report which is typically released on Wednesdays. That particular week, the expectation of over a dozen analysts who forecast weekly inventories was for a build of between 2M and 3M barrels. At 4:30pm EST on the 7th API released the results of their survey on inventories and it was a build of over 14M barrels.
YIKES! I thought as soon as I saw that headline number. I was watching the oil futures market at that time and the below chart is how the market reacted.

As you can see, Crude Oil futures lost 2% of its value pretty quickly. Let’s face it, that was an ugly number and the market reacted in a logical and reasonable manner.
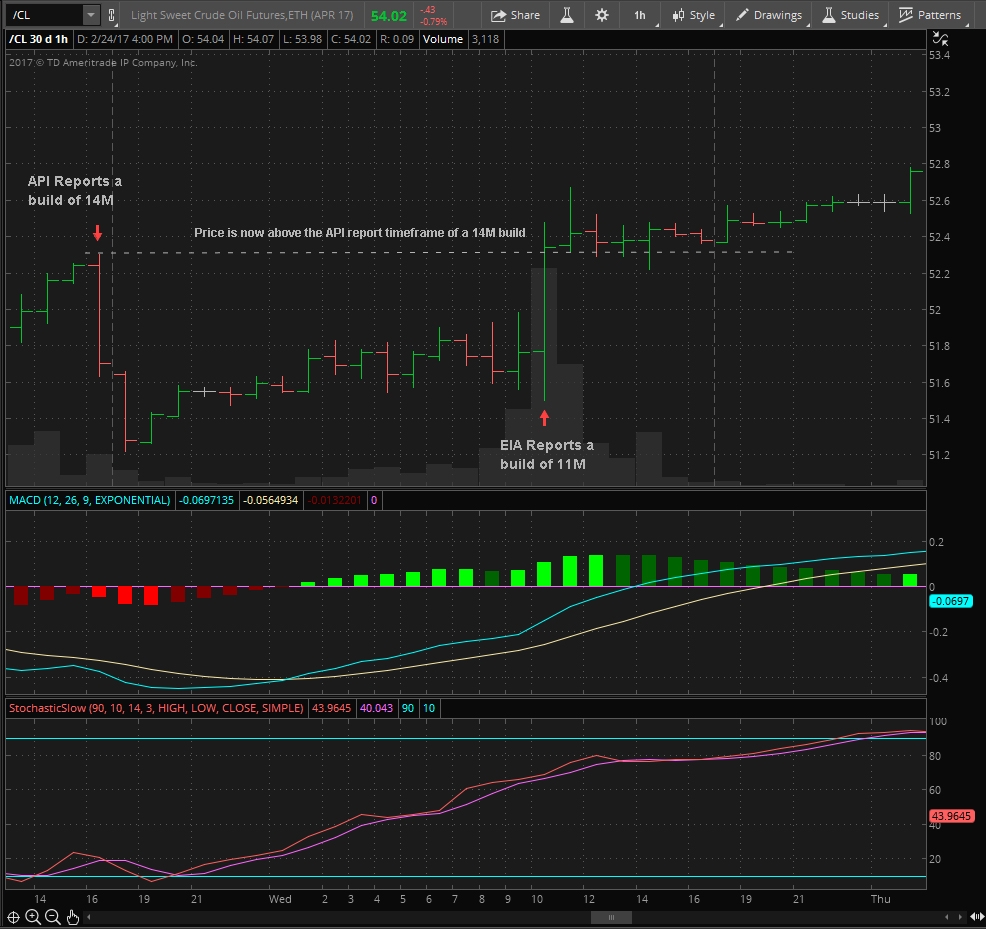
However, the API report is unofficial for a reason, and we really won’t know if the supply data is truly that bad until the official EIA report on the 8th. Fast forward to the EIA report the next day at 10:30am EST and the government reports a build of approximately 11M barrels. Now, in my opinion I’m thinking, “Ok Houston (Literally) we have a problem”. The 11M build would be the largest seasonal build on record and the largest overall build since the end of the 2016 summer driving season. Reasonable minds could easily conclude that when you’re setting bearish records with respect to supply that can not bode well for the commodity….Right?
The reaction to the official government report at 10:30am EST is depicted in the below chart.

So we did not incur a 14M barrel build, it was just an 11M barrel build compared to expectations of a 2M to 3M barrel build. That is still a ridiculous justification for the price action. To use an everyday analogy; The blanket fire didn’t burn the entire house down, we just lost most of the living quarters? That is a logical reason to celebrate...right?
Logic would suggest that given that week’s expectations, a build of such magnitude would have further justified the decline that started the prior evening with the release of the API report. In this case, it appears clear that using fundamental data points to deploy a trading strategy is not profitable.
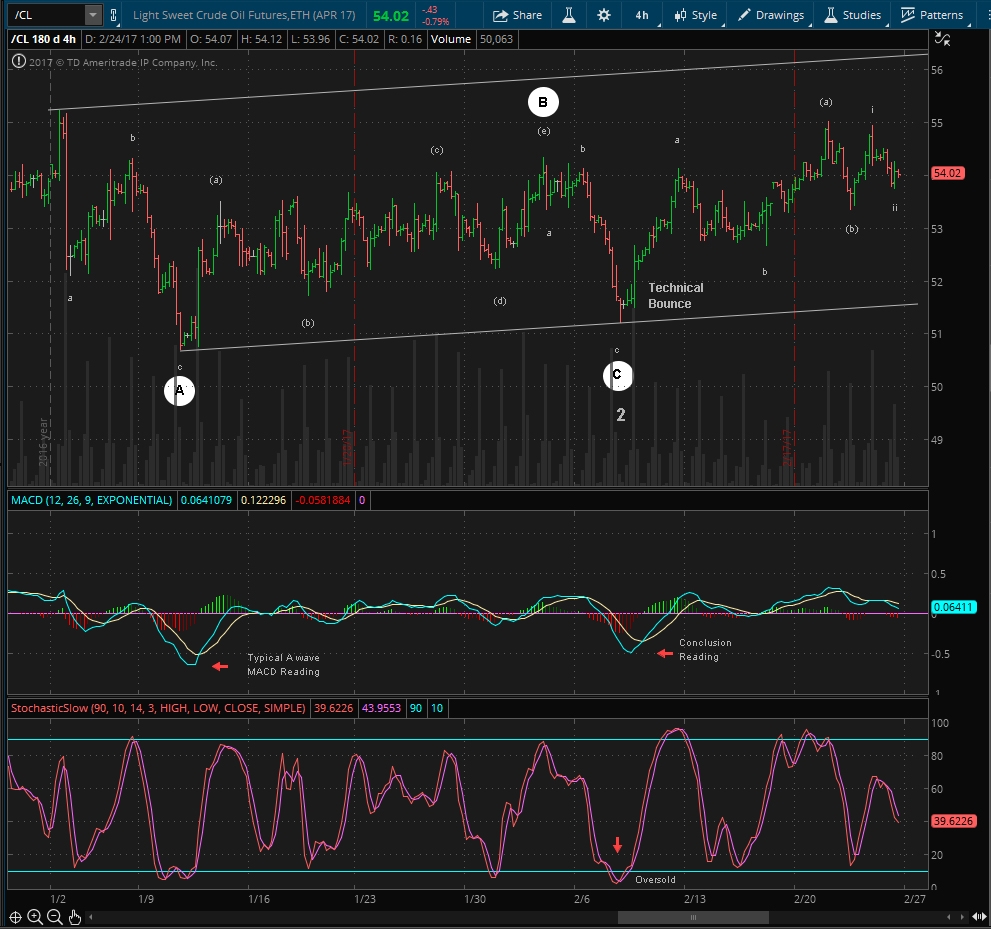
As traders, are we to assume ST trade strategy should not be based in any fundamental logic whatsoever? The above event is just one in many I could point out in which price appears to react to something other than what the fundamental data points out. Then what caused prices to rally on the heels of a massive 11M barrel build?
The below chart clearly illustrates this was technical in nature even though it was fundamentally counterintuitive.

Conclusion
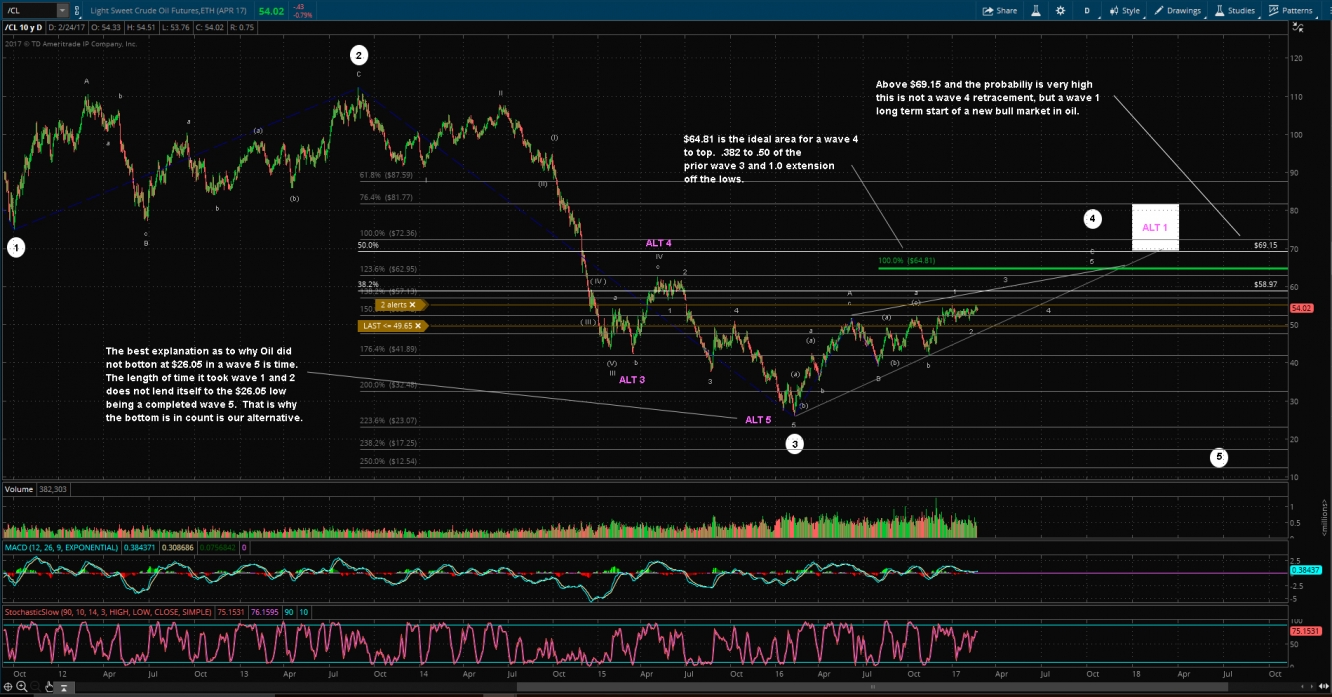
As of last week US domestic oil production is back above 9M bpd. The last time the US produced 9M bpd price had plummeted into the $30 - $40 range. Oil is trading in the mid $50’s now. The supply story is becoming more and more fundamentally bearish. The OPEC agreement aims to take 1.2M bpd off the global market and it appears members are largely compliant. However with US production up approximately 600k bpd from its production lows in spring 2016, the efforts of OPEC may be in vain. Lastly, let's not forget that oil is up 107% from it's February 2016 low. Logically, all the fundamental data points are aiming south for price.
However, we're traders, and we need a plan that apparently is not based on ST fundamental logic as pointed out above. We need a profitable plan in the ST so we look to the technical picture for direction. The below chart clearly illustrates that as long as oil stays above it's January low of $50.71, price is headed higher. To be specific...$64.81. Trader sentiment is still bullish in the face of clear bearish fundamentals. This is clear also when referring to the CBOE Crude Oil Volatility.
To conclude, I have experienced too many events like February 7th and 8th to know NOT to place a lot of value of the fundamental data points when deploying a short term trading strategy.

