· 8 ½ year Bear Market in Natural Gas has run its course.
· Bullish Technical Picture Taking Shape.
· Our Analysis shows Natural Gas to Double in Price over next 12 months.
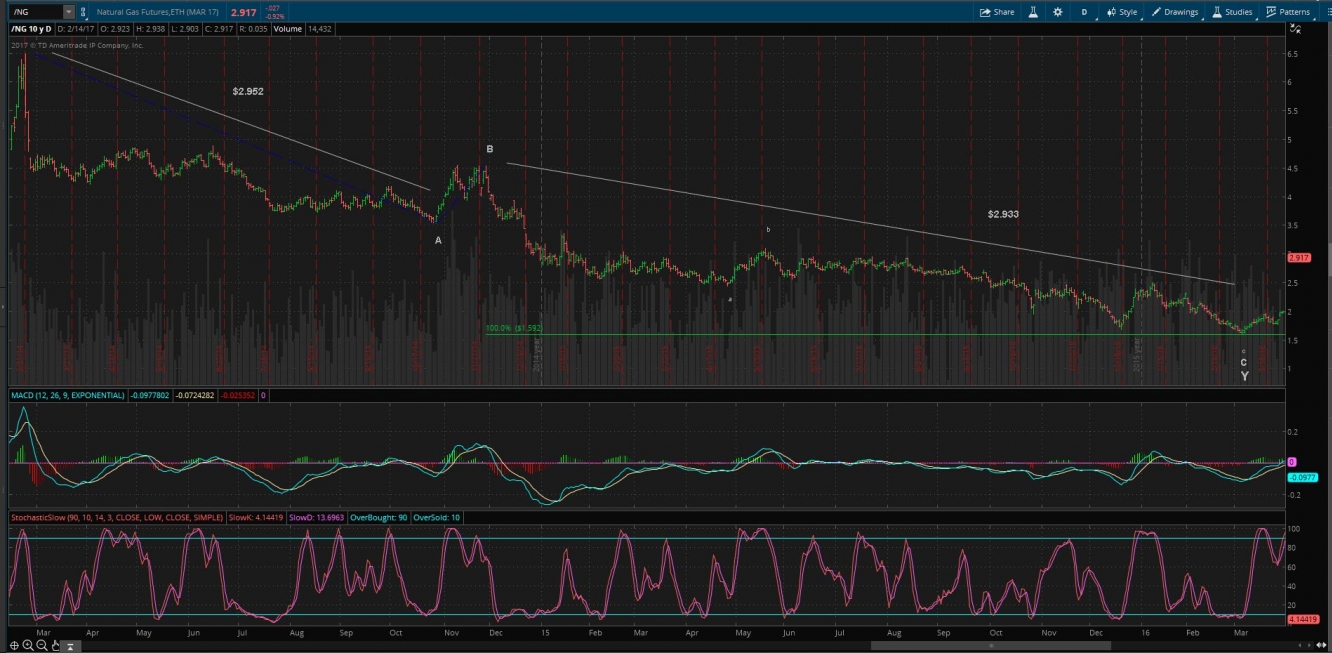
Natural Gas has been in a bear market since end of June 2008. It’s hard to imagine back then the commodity was trading just below $14. Having been in a bear market for 8 ½ years, Natural Gas appears poised to reverse trend for the long term.
Examination of the Bear Market Pattern for Completion
Although the larger pattern from 2008 shaped up to be an irregular WXY pattern. The final bottom was an almost perfect measured move right into the Fibonacci 1.0 extension to complete the C of Y wave at $1.611. According to R.N. Elliot, who founded the Elliot Wave Principle, Fibonacci 1.0 extension is a typical area where a corrective pattern will run its course.

Conclusion
We have solid evidence that the bear market in Natural Gas, which started in 2008 has all the elements in place to consider the 8 ½ year bear trend completed. For further confirmation, we need to examine price reversing and the pattern off the low of $1.611. If that reversal eclipses key retracement levels the odds will increase considerably that $1.611 was a true long-term bottom.
Examination of the Pattern off the $1.611 low
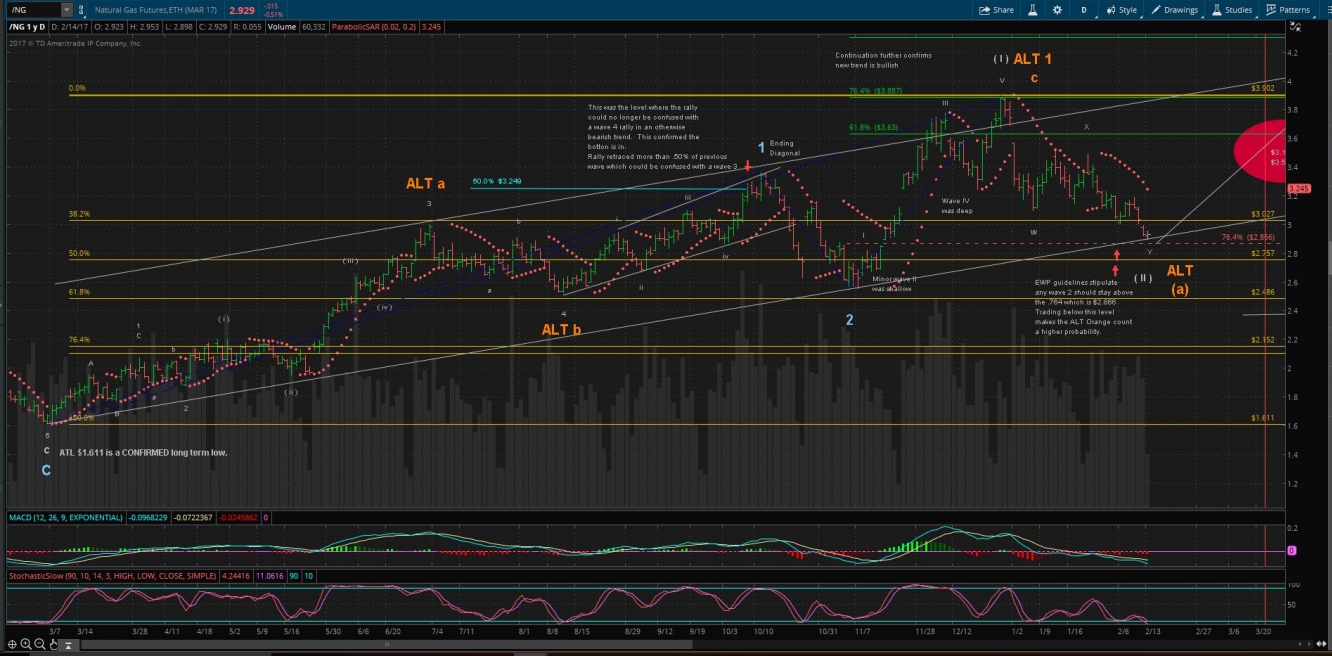
We can count a series of 5-wave patterns lending to their impulsive nature. However, when price traded above $3.249 on 10/10/2016 it traded above the important .50% retracement level of the prior wave 3. When Robert Prechter published Elliot’s wave principle theory in 1978, "The Elliot Wave Principle", he established clear rules and guidelines for the proper application of Elliot’s work. One guideline in particular is a corrective wave 4 should not exceed the .50% level of the prior wave 3. When this takes place, it increases the odds dramatically the wave 4 count is incorrect. In short, on 10/10/2016, the rally off the low could no longer be considered high probability it was a corrective rally within an overall bear market structure. To further confirm this, price continued to advance ultimately to $3.902 into 12/28/2016.

Conclusion
The pattern off the $1.611 low has traded high enough in an impulsive manner to no longer consider this new pattern as part of the overall previous bear market trend.
Summary
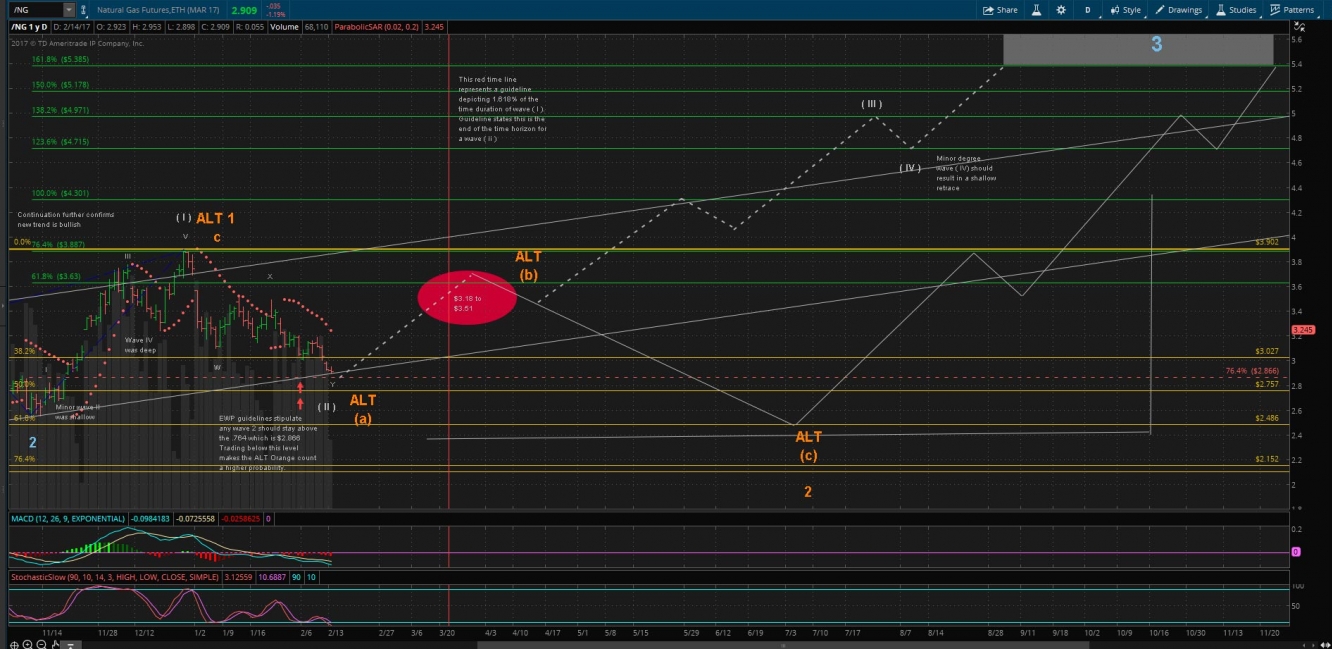
Based on our work in determining Natural Gas is in fact in a new long-term bull market trend, we conclude the possible pathway to higher highs is as depicted below. Our current technical perspective is Natural Gas should trade to at least $5.385 within the next 12 months. The two potential pathways are the white dotted, and the white solid line.

