It’s occasionally useful to stand back and examine markets from a long-term perspective. So, I’ve prepared the table below showing the 15-year gains in the Dow Jones Total Market Groups (DJTMG / weekly basis) along with precious metal assets (Black and Gold), major market indexes (Brown and Gold) and government statistics (Green and Gold). The dates list the Barron’s issues when the data was originally published.
My DJTMG data is not exactly as published in Barron’s. I like market history, being able to create charts that span decades. Unfortunately (for me), since October 1988, when Barron’s first began publishing DJTMG data, there have been momentous changes in finance, technology and the shopping habits of consumers. To compensate for these new trends in the market, Dow Jones and Barron’s have reconfigured the DJTMG several times since 1988 so it would accurately model the stock market with the passage of time. I have not always followed along from change to change. For the majority of the DJTMG indexes, this has not been a problem. After all, what significant changes have there been in Steel and Automobile Manufacturing since 1988? However, the changes in Finance and Technology since 1988 have been profound. There used to be two DJTMG indexes for Computers, one with IBM (NYSE:IBM), the other without. Today’s DJTMG has no Computer index at all, instead it groups computers with its Digital Hardware index.
I expect the data from Barron’s 20 July 2015 issue will document the inflationary high water mark of the post Bretton Woods $35 gold standard era. In the years (maybe months) to come, I anticipate the arrival of DEFLATION as a consequence of decades of reckless “monetary policy;” and with it, rising bond yields and interest rates, which will soon dominate markets.
A little background on market history is in order here. Barron’s 03 January 2000 issue was published at a time when the high-tech bubble was at its zenith, a time when most investors believed that investing in silicon chips and telecom stock (#86 and 97 in the table below) would allow them to retire with considerable wealth and security in the digital future. In the first week of the high-tech 21st century, few believed the share price of Microsoft (NASDAQ:MSFT) or Intel (NASDAQ:INTC) could possibly do anything but go up 20% each and every year. Faith in “monetary policy,” as personified by Alan Greenspan, was absolute, and 99% of those following the markets blindly accepted that the Federal Reserve System was dominated by genius, which guaranteed bear markets were a thing of the past. Robert Heller of the Federal Reserve certainly thought so in 1989.
"The Fed could support the stock market directly by buying market averages in the futures market, thus stabilizing the market as a whole. --- The stock market is certainly not too big for the Fed to handle."
- Robert Heller, former Governor of the Federal Reserve, 1989 WSJ interview.
Barron’s 20 July 2015 issue found itself published in a totally different world. After not one but two historic bear markets declines, Semiconductor (NYSE:SMI) and Software stocks (#86 and 87 in the table) are still 16% below their last all-time highs of March 2000, although the glamour stocks of the 1990s have remained the perennial favorites of “market experts.” Baby Boomers, if not wiser, are now fifteen years older and greyer. And truth betold, much of their grey hair comes from the realization that they are now saddled with oppressive debt as they approach retirement. Governments, corporations, college graduates, and consumers are also overloaded with debt. This toxic byproduct of Keynesian “monetary policy” (unpayable debt) isn’t going away anytime soon.
Janet Yellen now sits in Alan Greenspan’s chair and wrestles with the dilemma of when to increase the Fed Funds Rate from its current 0.10%. After six years of Zero Interest Rate Policy (ZIRP), could the Fed Funds Rate be increased to even 1.00% without crashing the global economy?
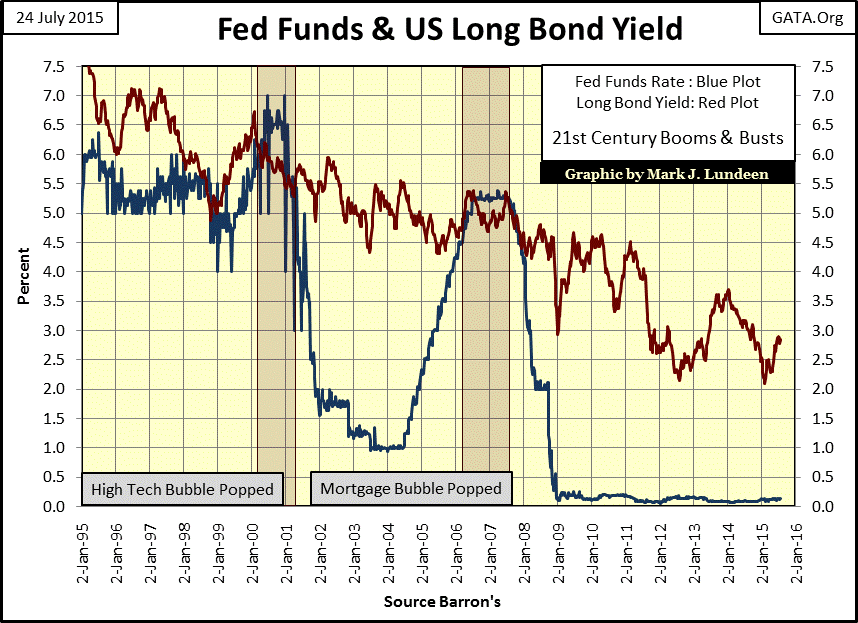
As she has already postponed scheduled increases in the Fed Funds Rate several times over the past few years, it appears she believes it can’t, but realizes that someday she must. When Yellen does finally begin to “normalize monetary policy” (increase Fed Funds Rate toward the pre-credit crisis level of over 5%), or maybe when the bond market initiates a selloff on its own, the markets will begin to deflate, and hundreds of trillions in interest-rate derivatives will come into the money. The myth of genius sitting around the table at the FOMC will vanish along with the last of many market bubbles they inflated since August 1971.
That’s how I see our uncertain future playing out. But now let’s have a look at what actually happened since the top of the high-tech bull market. Who would have predicted in January 2000 that Tobacco would be the #2 investment over the next fifteen years? Or that Healthcare Providers would be #1 after Obamacare legislation was passed? No one I can recall.
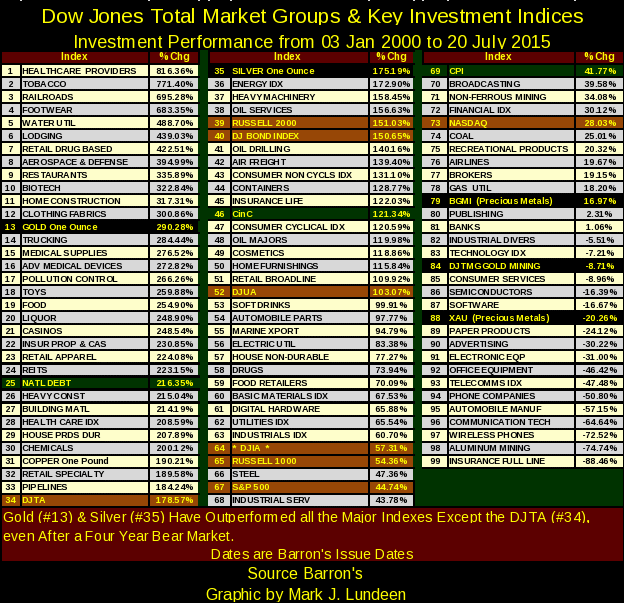
Even four years after the horrific market corrections beginning in 2011 (40% for gold and 70% for silver), the old monetary metals still managed to rank #12 and 33 in the table, with triple digit percentage advances. Of the major-stock indexes, only the Dow Jones Transports (#34) outperformed silver bullion these past fifteen years. The Dow Jones and S&P 500 (#64 and 67) may be within 3% of their last all-time high, but still nowhere near a double in valuation after all these years.
Here is a little snippet from the table above, using data from Barron’s 02 May 2011 issue when silver peaked at $48 an ounce. Silver and gold bullion were at #2 and 4, with the gold miners (BGMI and XAU) at #7 and 15. Energy was big in May 2011, with coal leading the pack at #1.
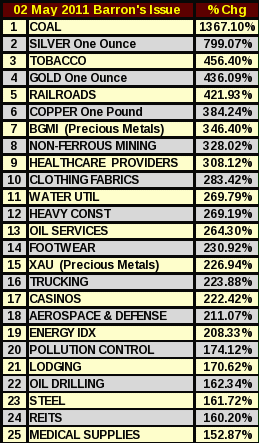
The significance of this little snippet is not just the strength in gold and silver back in May 2011, but how strong they’ve remained these past four years in the face of great adversity from the official sector and continual negative media coverage. I’m not saying money was made owning precious metals assets these past four years. However, compare the May 2011 gains in Coal and the Oil Drillers with their performance in the big table above for July 2015. All things considered, gold and silver (if not their miners) have held up better than energy producers under very difficult market conditions.
Let me explain something about the effects of monetary inflation on financial markets: the old canard that gold, silver and precious metal miners need inflation to see their valuations increase is absolutely false. Inflation is created by bank loans, and the big banks on Wall Street lend their inflationary dollars in such ways that support stocks, bonds and real estate. A businessman or hedge fund operator who asks JP Morgan (NYSE:JPM) for a loan of a few billion dollars for the purchase of gold or silver bullion for delivery outside the banking system would be laughed out the door. As a rule, banks refuse to allow monetary inflation to flow directly into precious metals. This is also true for corn, pork bellies or anything else that would inflate the cost of living; a margin account at a commodity broker contains your cash, not the banks', as is the case with a stock broker.
What drives the price of gold and silver higher are increasing concerns of deflation and counter party risk in a market with inflated stock and bond valuations, a market situation we find ourselves in currently. At the top of any financial bubble, the smart money knows the world is living in a fool’s paradise, and they begin exiting the market. Eventually, capital flight from the financial markets accelerates and a significant proportion of the wealth fleeing for its life rediscovers the safety of gold and silver.
That is exactly what happened from January 1970 to 1980. The entire 1970s bull market in gold and silver occurred as the Fed Funds Rate increased from 6% to 19%. During a full decade, when both gold and silver appreciated by over 2200%, no one dared say anything as foolish as “rising bond yields make gold and silver unattractive” because everyone in the 1970s knew that rising bond yields only made financial assets unattractive, and gold and silver glitter. But this wisdom from four decades ago has now been forgotten. No matter, as Mr Bear is always happy to re-educate the world on the evils of inflating the market with increasingly worthless currency, and the virtues of honest money.
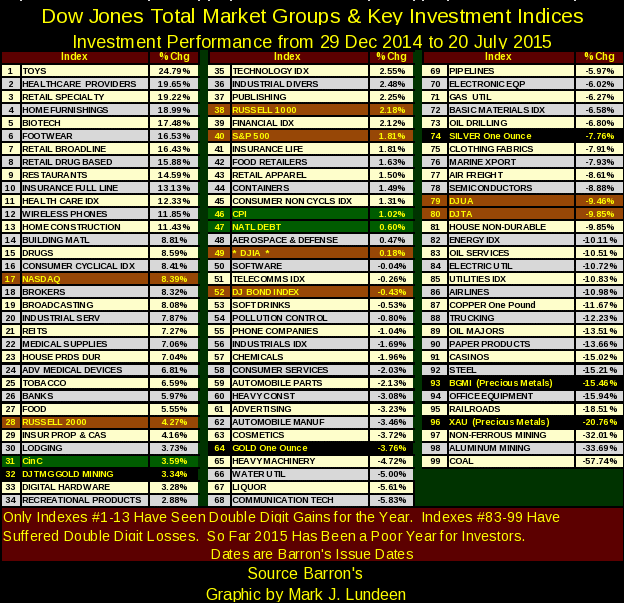
Let’s look at the same data, but from the first Dow Jones weekly close above 18,000 (Barron’s 29 December 2014 issue) to its 20 July 2015 issue. Only thirteen indexes have managed to rise by double digits over the past seven months, and only forty nine (including CinC, CPI and our shameful National Debt: #31, 46 and 47) managed to post a gain. So far, 2015 hasn’t been a good year for the markets, and those groups that have done well mostly involve consumption. When the economy turns south, they will too.
It’s no mystery why in 2015 the market has underperformed previous years. As is evident in the chart below, the Federal Reserve’s “injection” of monetary inflation into Wall Street had stopped by last December, about the time the Dow Jones first broke above 18,000. But note how Janet managed to monetize another 17 billion dollars of US Treasuries in June 2015 and no one noticed.
Look how small the monthly amounts of T-Debt Alan Greenspan “monetized” during the high-tech bubble up until the year 2000. Had Greenspan “injected” 17-billion dollars into Wall Street in a single month during the late 1990s, the cheap-credit junkies buying high-tech shares on margin would have gone into convulsions. Now look at the massive monthly “injections of liquidity” into the market beginning in November 2008. A quick review of my first table will show what this massive injection of dollars has done for the stock market. Since January 2000, the Dow Jones (#64) is only up only 57%, with the S&P500 (#67) and NASDAQ (#73) up only 45% and 28%. The old “policy” tricks don’t work as well as they once did, and everyone at the FOMC knows it.
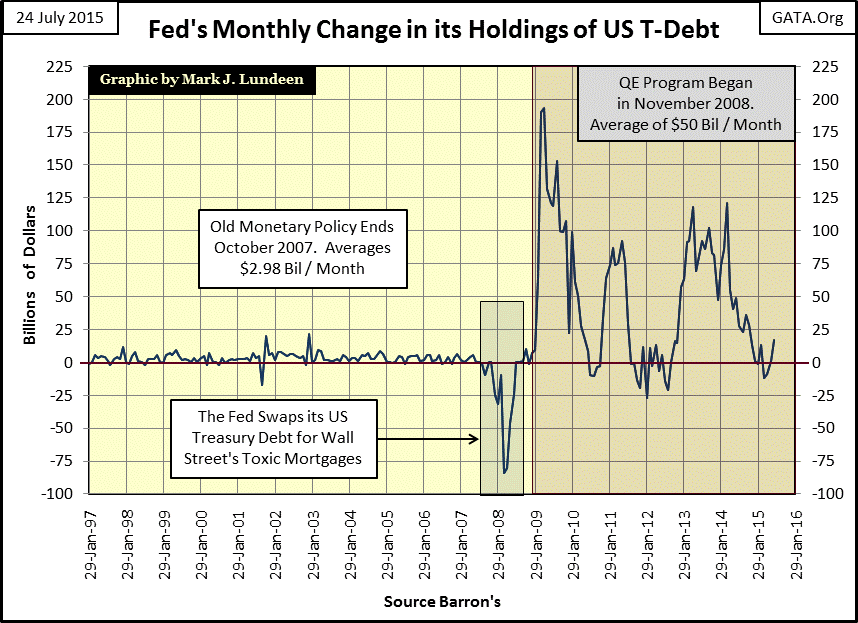
Considering the profound changes in “monetary policy” since October 2007, it strikes me that an equally monumental bout of deflation that will take everyone’s breath away is unavoidable. It’s unreasonable to believe otherwise, as Doctor Bernanke and Janet Yellen have baked deflation into the cake with their three post credit-crisis QEs. If history is any guide, the massive inflationary interventions seen above may have thwarted Mr. Bear’s efforts to drive market valuations back to reality in March 2009, but it did so only by reflating financial assets to higher and even less supportable levels. Deflation at the NYSE and NASDAQ and counterparty failure in the debt and credit markets from these three bouts of QE will inevitably result in a historic bull market in gold, silver and precious metals miners.
Currently, the Fed Chairwoman is struggling with the impossible task of safely exiting six years of ZIRP, an omen of the potential gains in owning gold and silver at today’s manipulated artificially low prices. When FOMC credibility crumbles and all hell breaks loose, the financial market will begin upchucking dollars by the tens of trillions, and there will be no more foolish talk about rising interest rates making gold and silver look “unattractive.”
