Is DAX Topping Out?
Last week the French president Emmanuel Macron was elected and shortly afterwards the European indices slowly slowed down the enthusiasm. Only the TOPIX was rising to record gains. The MSCI Asia Pacific Index climbed over 150 to its highest level since 2015. The S&P valuation is still under its highest levels during the tech bubble, but still feels overextended. What do technical analysis shows us and why do I think DAX might be topping out.
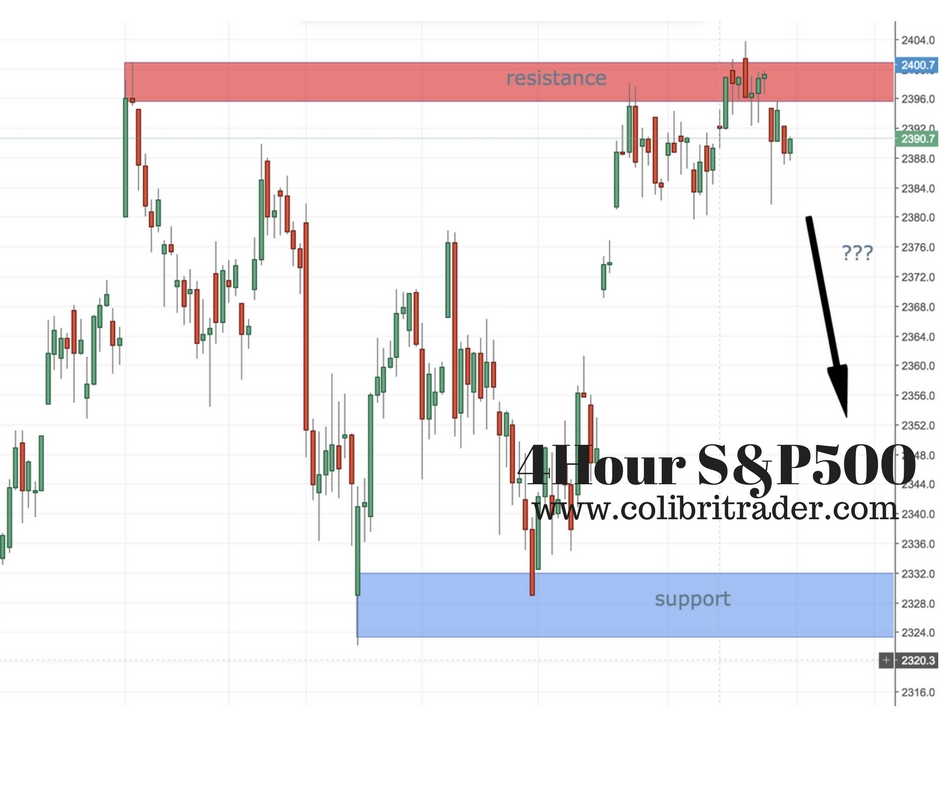
As you can see from the screenshot above, the S&P 500 looks like the final level of 2400 was reached and now is heading downhill. Looks like the strong resistance level established on the 09 of May might be an intermittent or a long-term top. I am not in the business of calling tops/bottoms, but just reading the price action of this chart makes me ask questions.
DAX (Germany 30)
On many occasions DAX has been a leading indicator in bull and bear moves.
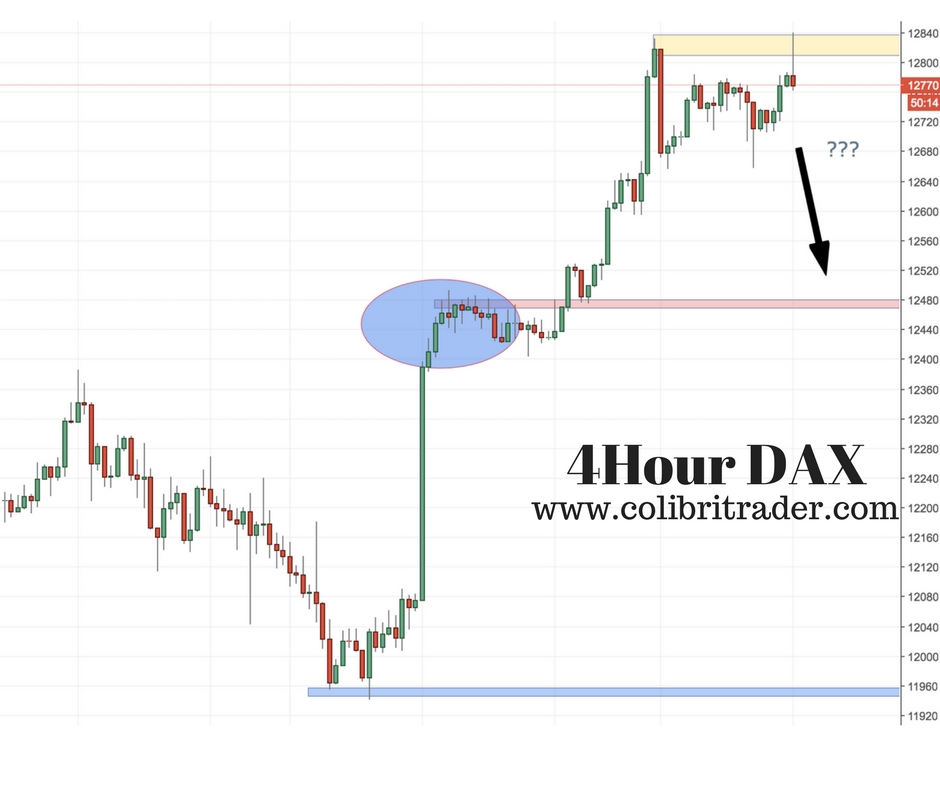
Why does it look so bearish when it is still in an uptrend, then? At some point that enthusiasm must diminish and probably the French elections might have done DAX a bad favor. Price action is showing a strong resistance and a possible 4H pin bar forming. Maybe it will take some time before we see more graspable bearish mood forming. It always takes longer around tops or bottoms, but once they are formed the change of trend is inevitable. As you can see from the chart above, I am looking at 3 pivot levels:
12,840 – Strong resistance level
12,480- Closest support level and a potential level price will bounce back from or break through
11, 960- the next support level, where price might bounce back
If daily price action confirms this level, this could be the beginning of a next leg down.


