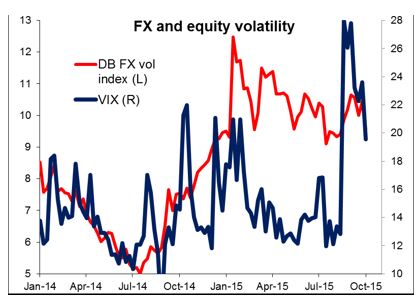
• More mean reversion The rethink of the nonfarm payrolls continued on Monday. Fed fund rate expectations as measured by the futures retraced a little more than half the ground that they lost on Friday as the strength in equities and the possibility of an upward revision to the nonfarm payrolls increased the possibility of a rate hike slightly. Ten-year bond yields, which dropped 4 bps on Friday, rose 6 bps to stand higher than they were before the number came out. (The two years though only regained 2.5 bps of the 6.5 bps that it lost on Friday.) And yet the S&P 500 continued to rise. High yield bonds bounced back as well, indicating more confidence in the economy. Volatility declined across markets, with the VIX index falling below 20 for the first time since late August.
• One reason for the bounce back was a solid number for the employment index of the non-manufacturing ISM index. The overall index was nothing to get excited about as it fell somewhat, but the employment index was strong and so was the employment index (rose to 58.3 from 56.0), which has a good correlation with the final figure for private nonfarm payrolls. That suggests to many people that the revisions to come may change the picture significantly and helped the markets to mean revert.
• With the rebound in confidence, the commodity currencies gained (plus some individual reasons – see below). On the other hand, the safe haven CHF was the weakest currency as people feel less need for a safe haven. USD/CHF is opening almost exactly where it opened on Thursday, when people were looking forward to a good NFP the following day. EUR/USD is once again opening with a 1.11 handle – yesterday it was a 1.12 handle. So despite the NFP shock on Friday, it’s still in the range it’s been in for several weeks now.
• Australia keeps rates steady, as expected The RBA kept rates unchanged, as expected, and maintained its neutral stance. They seemed relatively content with the state of the world, saying that there was some further softening in conditions in China and east Asia of late, but stronger US growth and that Equity market volatility has continued, but the functioning of financial markets generally has not, to date, been impaired. This makes us think that they are unlikely to lower rates in the near future, and indeed, the futures are showing only a very small chance of a change over the next year, with the odds of a cut or a hike nearly balanced (17.5% chance of a cut, 15.3% chance of a hike = 67.2% likelihood of no change). This helped AUD to recover today.
• TPP to help NZ milk exports The Trans Pacific Partnership trade deal between the US, Japan and 10 other Pacific Rim countries has been concluded. It will gradually open the Canadian market to foreign milk slightly. This helped NZD this morning.
• Today’s highlights: German factory orders for August unexpectedly fell by 1.8% mom vs an expected rise of +0.5% mom. To make matters worse, the July figure was revised down sharply as well. Orders from the Eurozone rose, but domestic orders fell and orders from outside the Eurozone fell by the most of all. The figures show that Germany is vulnerable to the downturn in global trade just like any other country. Of course, the figures are likely to be even worse in the future as a result of the Volkswagen (XETRA:VOWG) scandal. This is negative for the EUR in that any weakness in Europe’s biggest economy increases the likelihood that the ECB eventually ramps up its QE program.
• From Canada, we get the Ivey PMI for September. Following the decline in the RBC manufacturing PMI last week, we could see a decline in the Ivey figure as well. Coming on top of the low oil prices, CAD could come under renewed selling pressure.
• From the US, we get the trade balance for August.
• As for the speakers, ECB President Mario Draghi and Kansas City Fed President Esther George speak. Draghi is giving a welcome speech at the Art on Site Inauguration; it doesn’t sound like the venue for any major policy initiatives. George is one of the most hawkish people on the FOMC. Her comments are likely to reinforce the idea that the Fed is still on track to hike rates this year, the September nonfarm payrolls notwithstanding. That could firm up the dollar.
The Market
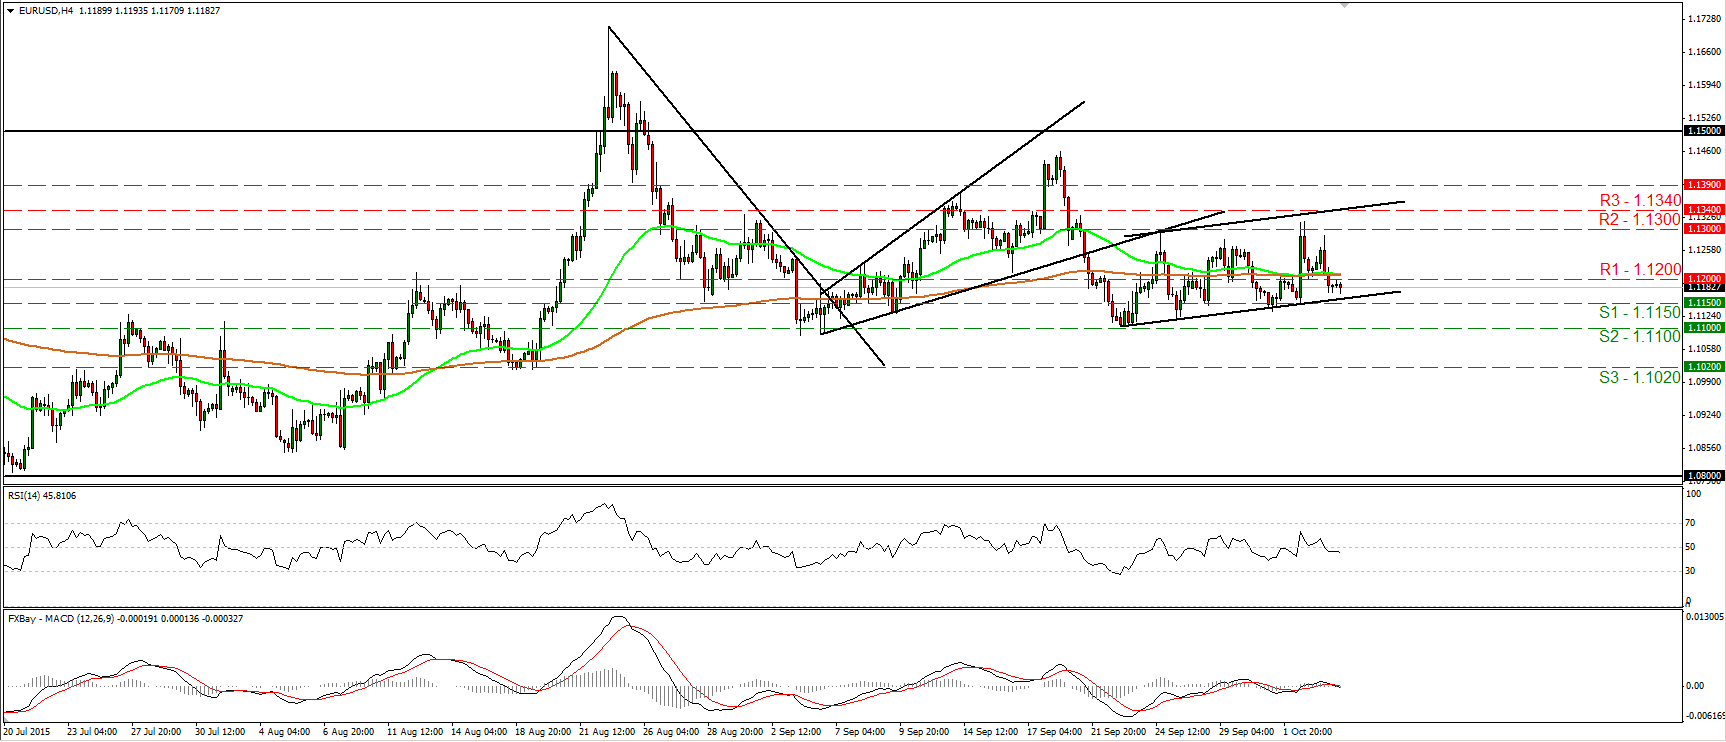
EUR/USD hits resistance fractionally below 1.1300 and slides
• EUR/USD traded higher on Monday, but found resistance marginally below the 1.1300 (R2) line and slid to trade back below the 1.1200 (R1) barrier. Having in mind that the rate is back below 1.1200 (R1), I would adopt a neutral stance for now with regards to the short-term picture. The RSI is now back below 50 and points sideways, while the MACD has turned negative again and fell below its trigger line. The fact that both these indicators oscillate above and below their equilibrium lines supports my choice to stay flat for now. In the bigger picture, as long as EUR/USD is trading between the 1.0800 key support and the psychological zone of 1.1500, I would hold a flat stance as far as the overall picture is concerned. I would like to see another move above 1.1500 before assuming that the overall outlook is back to positive. On the downside, a break below the 1.0800 hurdle is the move that could shift the picture to negative. • Support: 1.1150 (S1), 1.1100 (S2), 1.1020 (S3) • Resistance: 1.1200 (R1), 1.1300 (R2), 1.1340 (R3)
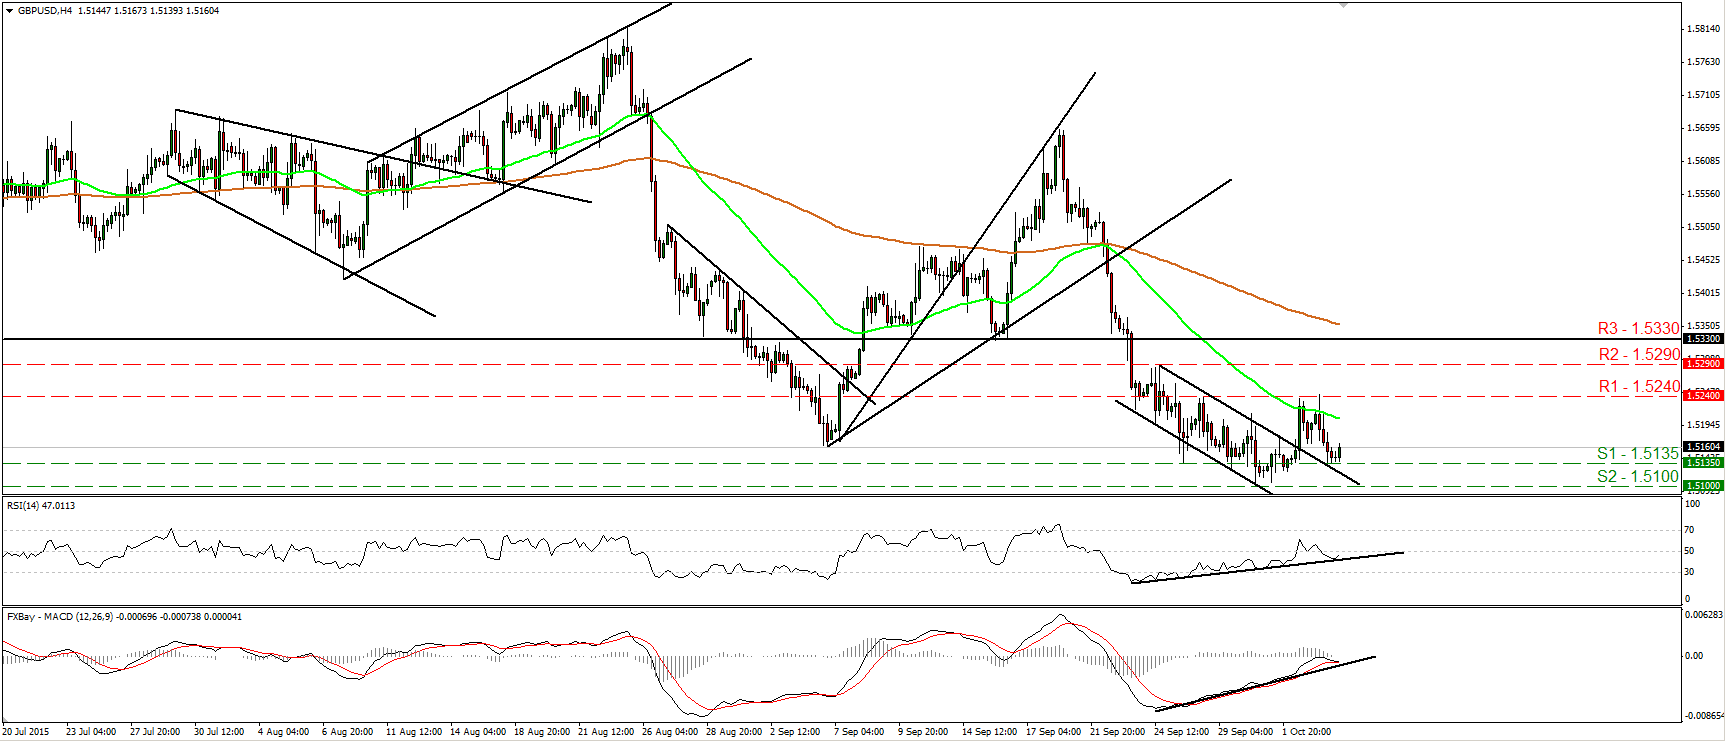
GBP/USD rebounds from 1.5135
• GBP/USD traded lower yesterday but found support at the 1.5135 (S1) barrier. Today, during the Asian morning, cable rebounded somewhat. Given that the rate is still trading above the upper bound of the short-term downside channel, I see the possibility for the next wave to be positive, perhaps for another challenge at the 1.5240 (R1) zone. Our short-term oscillators support the notion as well. The RSI rebounded from its upside support line and now appears ready to move back above 50, while the MACD shows signs that it could rebound from its support line as well. Plotting the daily chart, I see that cable remains below the 80 day exponential moving average. That moving average shifted somewhat down, which turns the overall picture cautiously negative in my opinion.
• Support: 1.5135 (S1), 1.5100 (S2), 1.5030 (S3)
• Resistance: 1.5240 (R1), 1.5290 (R2), 1.5330 (R3)
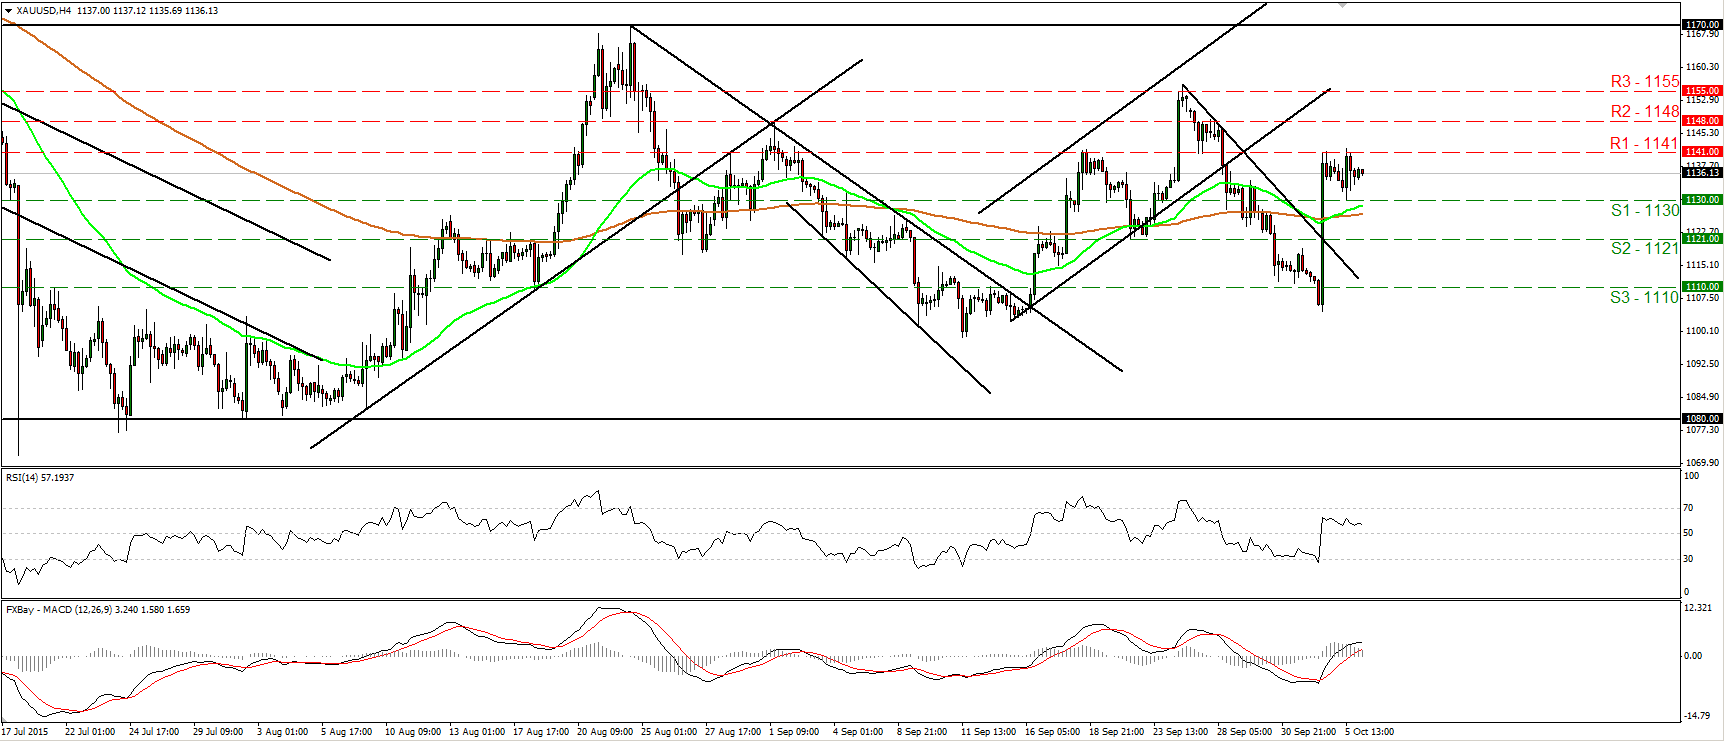
Gold consolidates below 1141
• Gold traded in a consolidative manner yesterday, staying slightly below the resistance hurdle of 1141 (R1). I still believe that since the metal has broken above the short-term downtrend line taken from the peak of the 24th of September, the short-term bias has turned positive. A clear move above 1141 (R1) is likely to carry more bullish extensions and perhaps aim for the next resistance at 1148 (R2). Taking a look at our short-term oscillators though, I see that a retreat could be on the works before the bulls decide to shoot again. The RSI, although above 50, has turned down again, while the MACD shows signs of topping slightly above its zero line. As for the bigger picture, with no clear trending structure on the daily chart, I would hold my neutral stance as far as the overall outlook is concerned. I believe that a close above 1170 is needed to signal a newborn medium-term uptrend.
• Support: 1130 (S1), 1121 (S2), 1110 (S3)
• Resistance: 1141 (R1), 1148 (R2), 1155 (R3)
AUD/USD edges up following the RBA decision
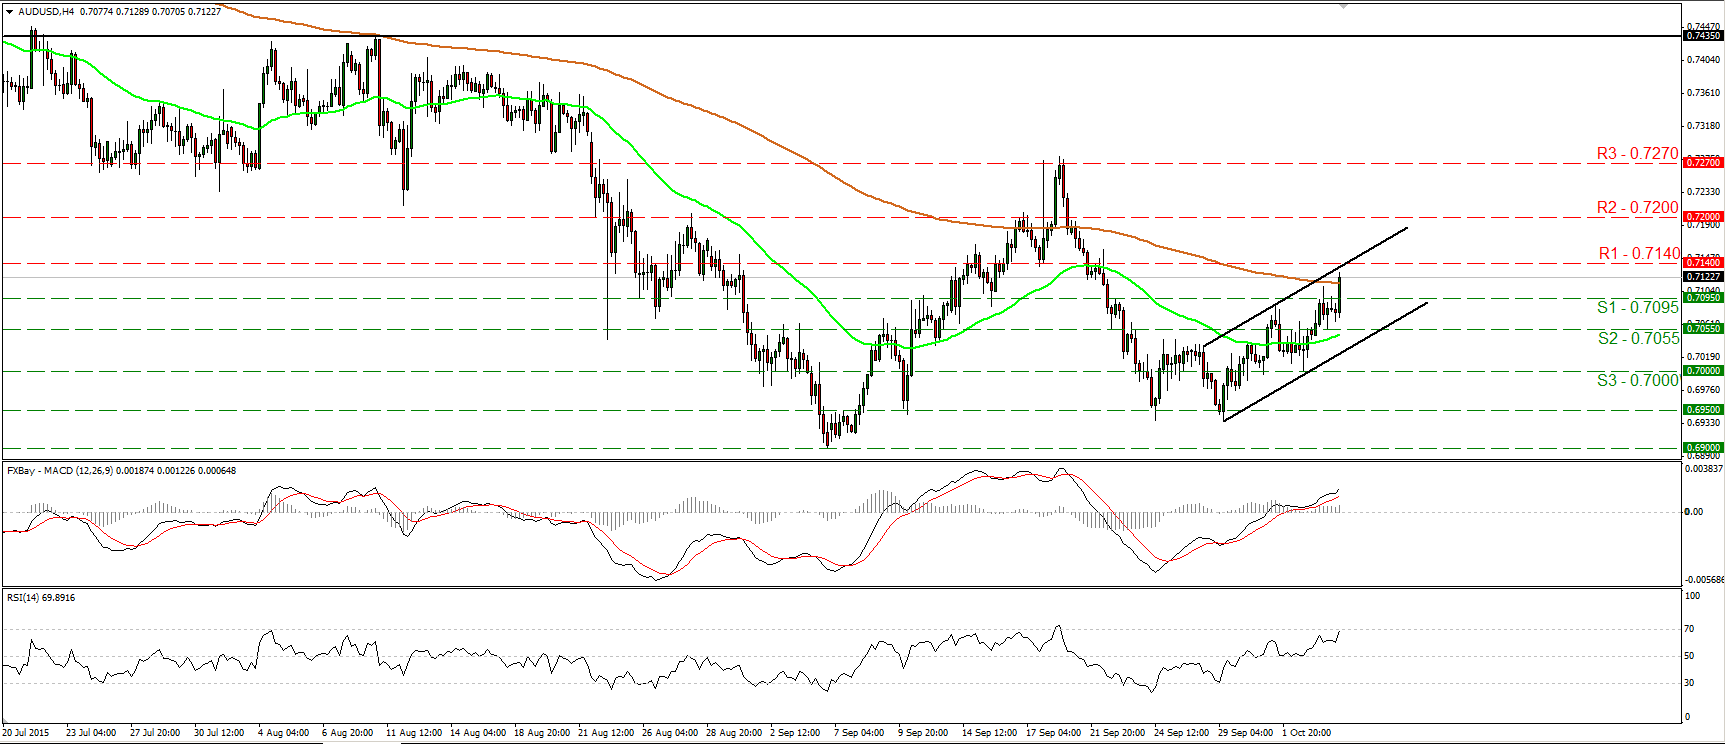
• AUD/USD traded higher during the early European morning after the RBA decided to keep its benchmark interest rate unchanged and said that it sees inflation remaining consistent with the target over the next one to two years. The pair is trading within a short-term upside channel and therefore I would consider the short-term picture to stay positive. At the time of the release, AUD/USD emerged above the 0.7095 (S1) line and at the time of writing is headed towards the resistance of 0.7140 (R1). A break above 0.7140 (R1) is likely to carry larger bullish implications and perhaps aim for the 0.7200 (R2) zone. Our short-term oscillators detect strong upside speed and support the positive near-term picture. The RSI moved higher and now looks able to cross above its 70 line, while the MACD stands above both its zero and signal lines and points north. Nevertheless, although I would expect the rate to continue its near-term uptrend, given our proximity to the upper bound of the upside channel, I would be careful of a possible setback before the bulls take the reins again. On the daily chart, I still see a major downtrend. However, the fact that the rate printed a higher low near 0.6950 is the reason I would stay flat for now with regards to the broader trend.
• Support: 0.7095 (S1), 0.7055 (S2), 0.7000 (S3)
• Resistance: 0.7140 (R1), 0.7200 (R2), 0.7270 (R3)
WTI finds resistance slightly below 47.00
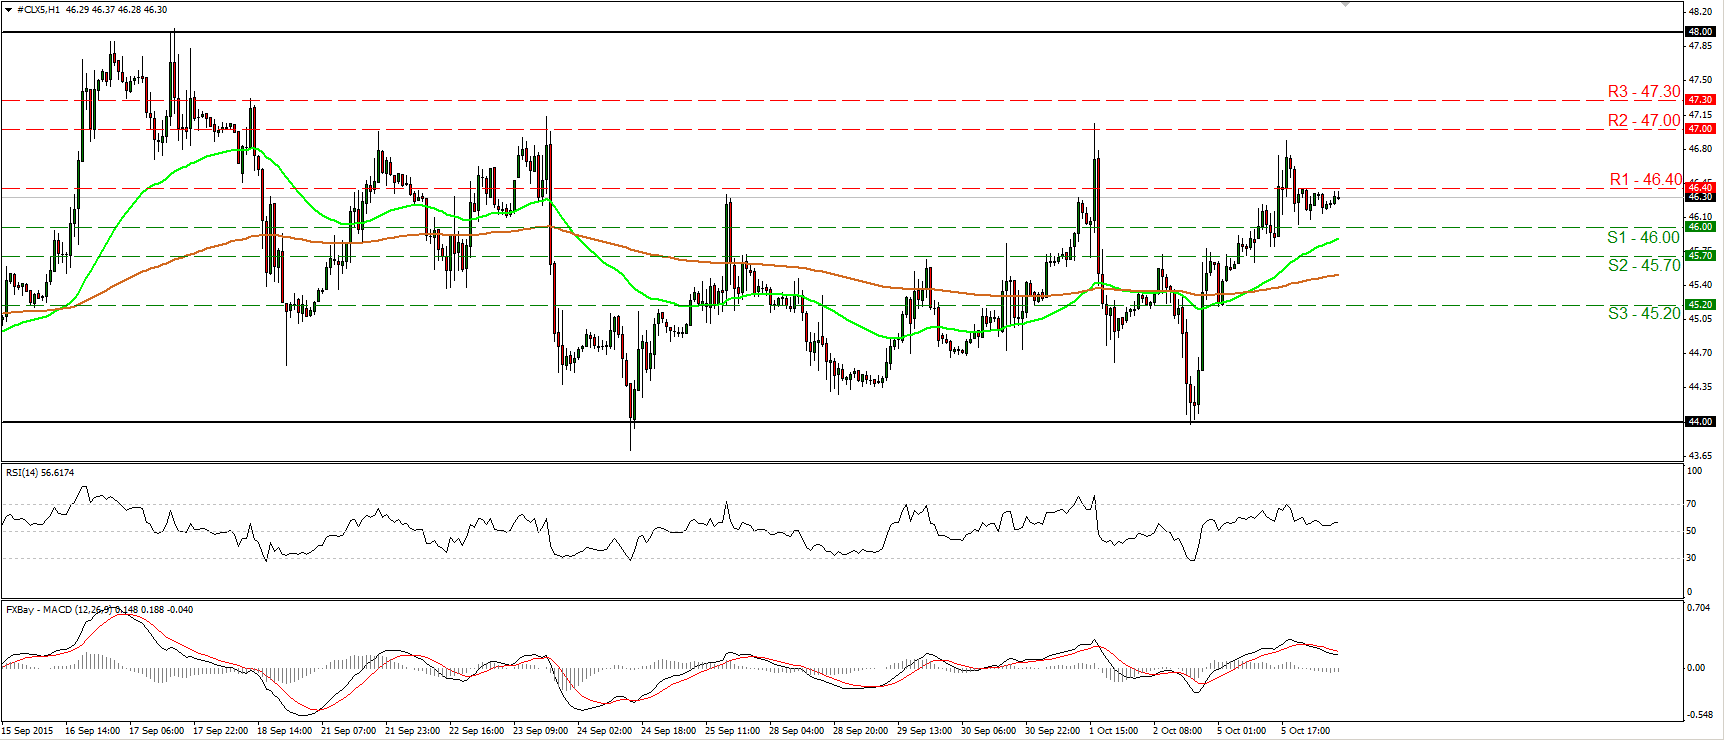
• WTI traded higher yesterday, but hit resistance slightly below 47.00 (R2) and retreated to find support fractionally above 46.00. Although we do not have a clear trending structure on the 1-hour chart, I would expect the forthcoming wave to be positive. A clear move above 46.40 (R1) is likely to confirm the case and perhaps open the way for another test near 47.00 (R2). Our hourly momentum studies support the notion somewhat. The RSI shows signs of bottoming slightly above its 50 line, while the MACD, already positive, shows signs of bottoming as well and could move above its trigger line soon. In the bigger picture, WTI has been trading in a sideways mode between 44.00 and 48.00 since the 1st of September. As a result, I would consider the longer-term picture to be flat for now.
• Support: 46.00 (S1), 45.70 (S2), 45.20 (S3)
• Resistance: 46.40 (R1) 47.00 (R2), 47.30 (R3)
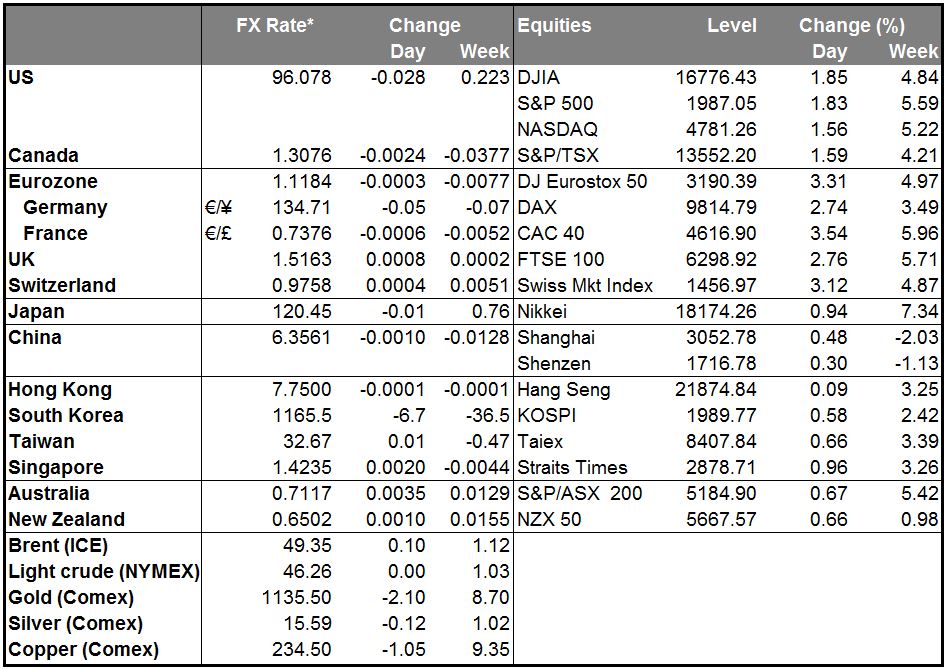
BENCHMARK CURRENCY RATES - DAILY GAINERS AND LOSERS
MARKETS SUMMARY

