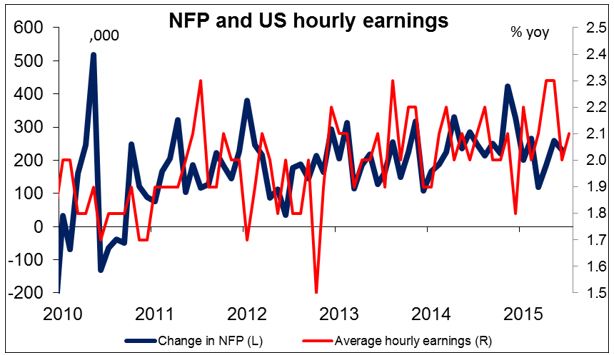
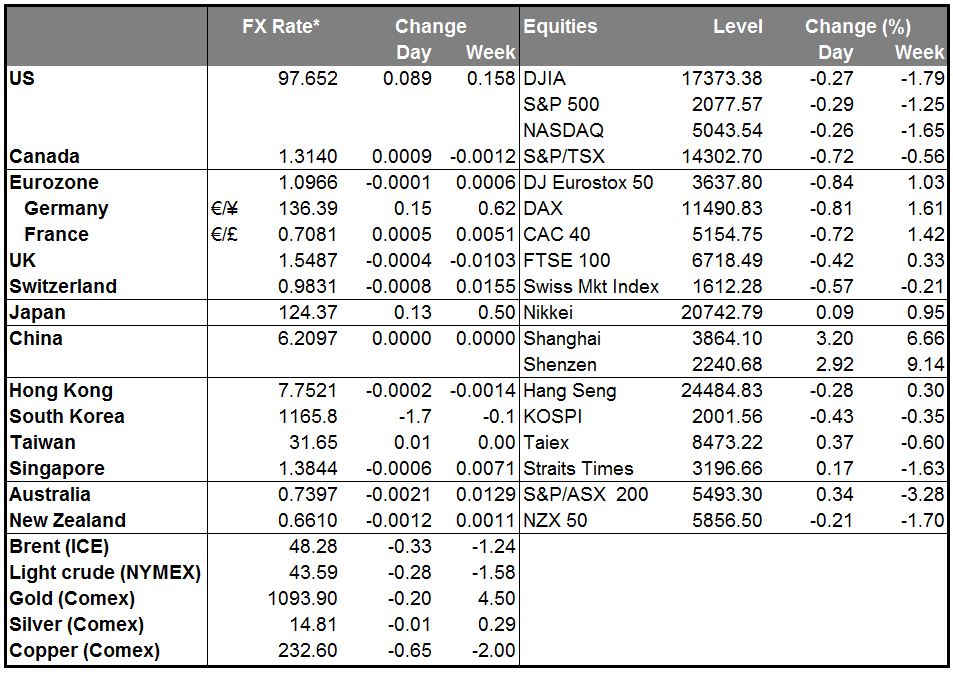
• NFP in line with expectations, impact lasts two hours Friday’s US nonfarm payrolls were pretty much in line with expectations. EUR/USD fell about one cent on the news, which pretty much confirmed that a rate hike is coming this year (December if not September). But the impact on market thinking was hardly straightforward: Fed funds rate expectations out to October 2016 gained up to 2 bps, but dates after that gained less and expectations for November 2017 and out actually declined. The 215,000 gain in payrolls, steady 2.1% yoy growth in average hourly earnings, and the unemployment rate remaining at 5.3% will certainly be enough for Atlanta Fed President Lockhart, who said last week that only a “significant deterioration” in the data could change his mind. On top of that, hours worked surged in July, which could indicate that the economy is gaining momentum. The question is whether the data were good enough to convince people like Fed Gov. Powell, who put forward a less certain outlook last week.
• In that case, why did the dollar reverse two hours later and why is it opening mostly lower this morning, particularly against the EM currencies? Several reasons. First off, position-cutting ahead of vacations. People may well have taken advantage of the stronger dollar to sell out in preparation for their holidays. Secondly, oil prices fell further. The Fed may want to start raising rates in September, but if commodity prices continue to weaken, the ultimate level that the Fed hikes to – the “terminal rate” – is likely to be lower than otherwise expected. That would explain why short-term expectations could rise but long-term expectations fall.
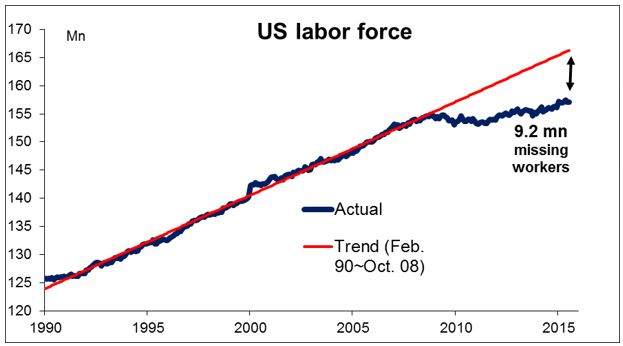
• Finally, the NFP data shows that the US labor force is barely growing. Indeed, the drop in the unemployment rate from 5.5% in May to 5.3% in June and July was entirely accounted for by a fall in the participation rate, not from higher job growth. There are some 9mn “missing” workers in the US, if we look at the trend growth in the labor force that existed for many years before the 2008 financial crisis. The Fed doesn’t expect these people to come back to work. Slower growth in the labor force plus little growth in productivity – look for the revised US productivity figures tomorrow – means slower long-term growth in the US. That again would indicate a lower terminal Fed funds rate and hence less appreciation for USD over the long term.
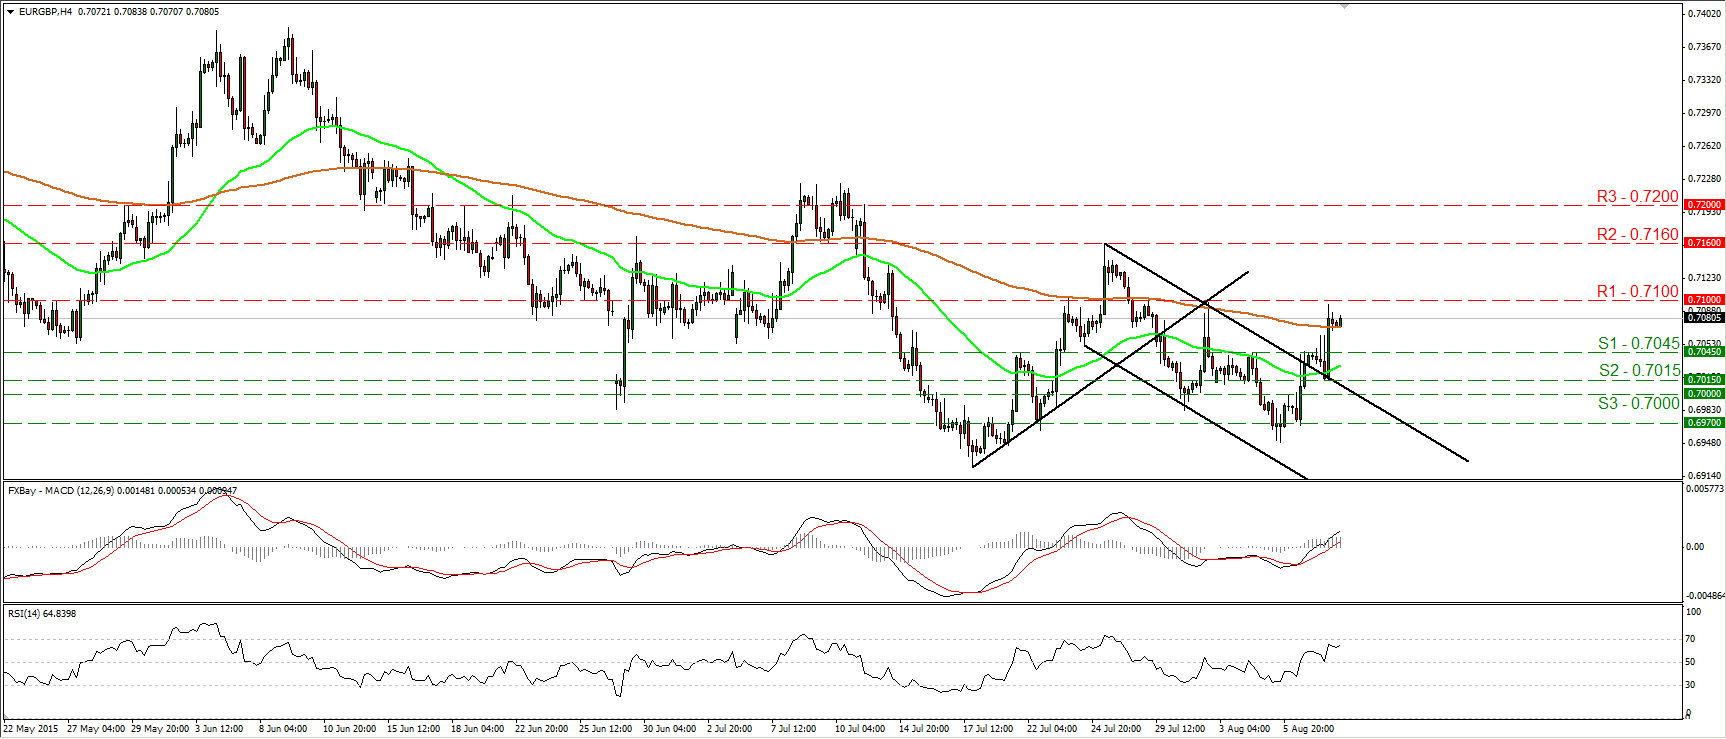
• UK rate expectations no longer following US One notable point from the NFP aftermath: normally, UK rate expectations rise when Fed rate expectations rise, based on the idea that a) a Fed move would provide political cover for the Bank of England to move, and b) both countries are affected similarly by global inflationary trends. This time, however, it was notable that UK rate expectations didn’t budge, and in fact, GBP weakened against USD. This reinforces my view that GBP may well be weak until investors regain confidence that the BoE is likely to raise rates in the foreseeable future. That could be the next BoE meeting, scheduled for Sep. 10th. The near-term technical picture too looks good for EUR/GBP (i.e., bad for GBP). See technical section for more details.
• EUR/CHF hits post-float high EUR/CHF hit 1.07892 during trading Friday. This was about the same as the highest European close (1.07894 on 19 Feb) since the pair was allowed to float again in January. Swiss National Bank (SNB) Vice President Fritz Zurbruegg was interviewed in a local paper and made some hawkish statements, such as “the franc still is strongly overvalued.” He said the SNB hasn’t seen any increase in demand for cash, which means that there’s still room for them to lower interest rates further, something they are “of course contemplating.” He added that rates are likely to remain low for longer than people may have expected, because “the global recovery is so slow.” And if that doesn’t work, they’re ready to intervene. All told, it looks to me like CHF is headed lower. It may gain vs some currencies that still have room to cut rates further, such as AUD and NZD, but it’s likely to depreciate vs EUR and USD, as domestic investors move money abroad in search of not just higher yield, but indeed any yield at all, as Swiss bond yields are negative out to and including 10 years.
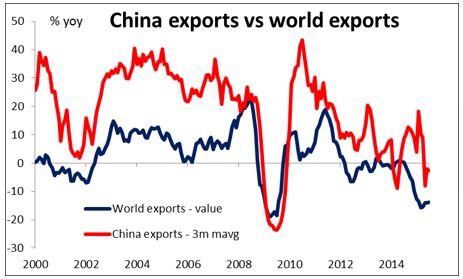
• China trade far below estimates, CPI accelerates China’s trade figures for July, announced on Saturday, corroborate the story of slowing global trade. Exports collapsed 8.3% yoy, far more than expected, while imports were also down 8.1% yoy, an acceleration from -6.1% yoy in June. These figures are by value, not volume, so the import side is likely to be depressed by the fall in commodity prices, but the export side relies more on manufactured goods and therefore probably is not distorted as much. (The volume figures aren’t available yet.) The data show that China can no longer rely on exports for growth. This is in fact the government’s aim, to diversify the economy away from export-led investment and towards domestic growth, so it actually shows some success. Nonetheless, there are always winners and losers from every change in the business model, and there are likely to be a lot of export firms that are losing. Weaker exports may encourage the authorities to allow CNY to weaken, which could help to trigger another round of “currency wars” in Asia. No surprise then that AUD and NZD opened lower this morning, although still higher vs USD than they were Friday morning. I expect them to continue to weaken over the medium term as the terms of trade move against them.
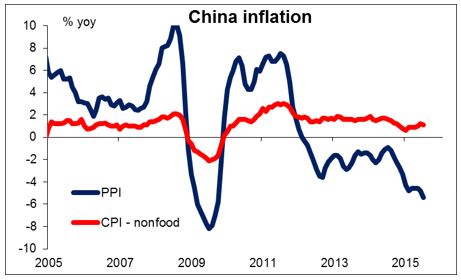
• China also released on Sunday its CPI and PPI for July. The longstanding trends continued: CPI growth accelerated more than expected, while PPI deflation also beat expectations. Nonetheless, CPI inflation at 1.6% still remains about half the central bank’s target of 3%, so it means there’s plenty of room – make that need – for further stimulus. That may explain why stocks were up sharply this morning: falling exports and deepening deflation at the factory gate level are likely to elicit more of a policy response, the “QE with Chinese characteristics” that we are seeing now with such measures as increased funds going to the policy banks, a government fund to stabilize stock prices, and accepting municipal bonds as collateral.
• Today’s highlights: On Monday, the calendar is relatively light, with only data of secondary importance due to be released.
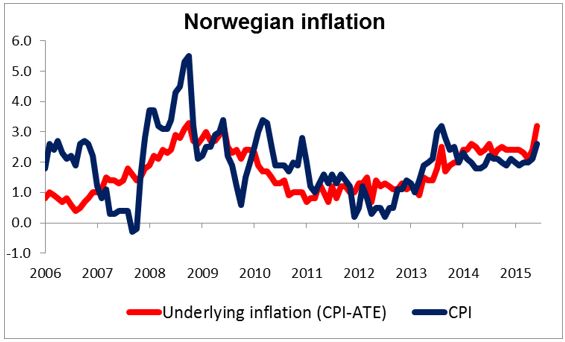
• During the European day, Norway’s CPI for July is expected to decelerate a bit. Last month, NOK surged after the country’s core inflation rate beat estimates and the headline figure accelerated to 2.6% yoy from 2.1% yoy previously, a touch above the 2.5% target. Even though the strong data are likely to take some pressure off the Norges Bank to ease further at its September meeting, I would prefer to see the actual figure before getting confident about this idea. If indeed the July CPI is still above target, NOK could strengthen somewhat, at least temporarily.
• In the US, we get the labor market conditions index for July. This is a monthly index that draws on a range of data to produce a single measure to gauge whether the labor market is improving overall. Although not major market mover, the LMCI index will show the broader US labor conditions following Friday’s US employment report for July.
• As for the speakers, Atlanta Fed President Dennis Lockhart speaks. His comments last week touched off a firestorm after he said it would be appropriate to start hiking rates in September. It will be interesting to hear his comments on Friday’s labor market report as well as any riposte he might make to Fed Gov. Powell, who said following Lockhart’s comments last week that “nothing has been decided.”
• As for the rest of the week, on Tuesday, the main event will be the German ZEW survey for August. The survey for July added to the weak data coming out from the country, with the expectations index declining and only a modest increase in the current situation index. With the Greek crisis and Grexit risk having diminished, however, we could see an improvement in expectations towards the end of the Q2. This will most likely keep alive the scenario that the Eurozone recovery could start to gather momentum again and strengthen EUR a bit.
• On Wednesday, China releases its retail sales, industrial production and fixed assets investment for July. It is expected to be a mixed report, which could boost hopes for further stimulus. It remains to be seen though whether AUD and NZD can benefit; in theory they should, but as we saw today, the local stock market rose on such hopes but the currencies didn’t.
• In the UK, we get the unemployment rate for June. Another decline in the rate and acceleration in the growth of average weekly earnings is likely to strengthen GBP.
• On Thursday, the highlight will be the US retail sales for July. Retail sales unexpectedly declined in June, and the May increase was revised down. This frustrated investors who have being looking for signs that the soft Q1 data was coming to an end. Nevertheless, given the strong 1st estimate of US GDP and expectations for a rebound in July’s retail sales figure, we would expect USD bulls to gain confidence again and strengthen the greenback on the news.
• Finally on Friday, in Europe, the main data will be the preliminary Q2 GDP figures for France, Italy, Germany and the Eurozone as a whole. Eurozone’s preliminary GDP rate for Q2 is expected to have risen at the same pace as in Q1, while figures released from Germany, Europe’s growth engine, is likely to show that the economy expanded moderately from Q1. Investors will most likely watch the French, Italian and German data released earlier in the day for the overall growth outlook of the bloc and EUR will react accordingly.
The Market
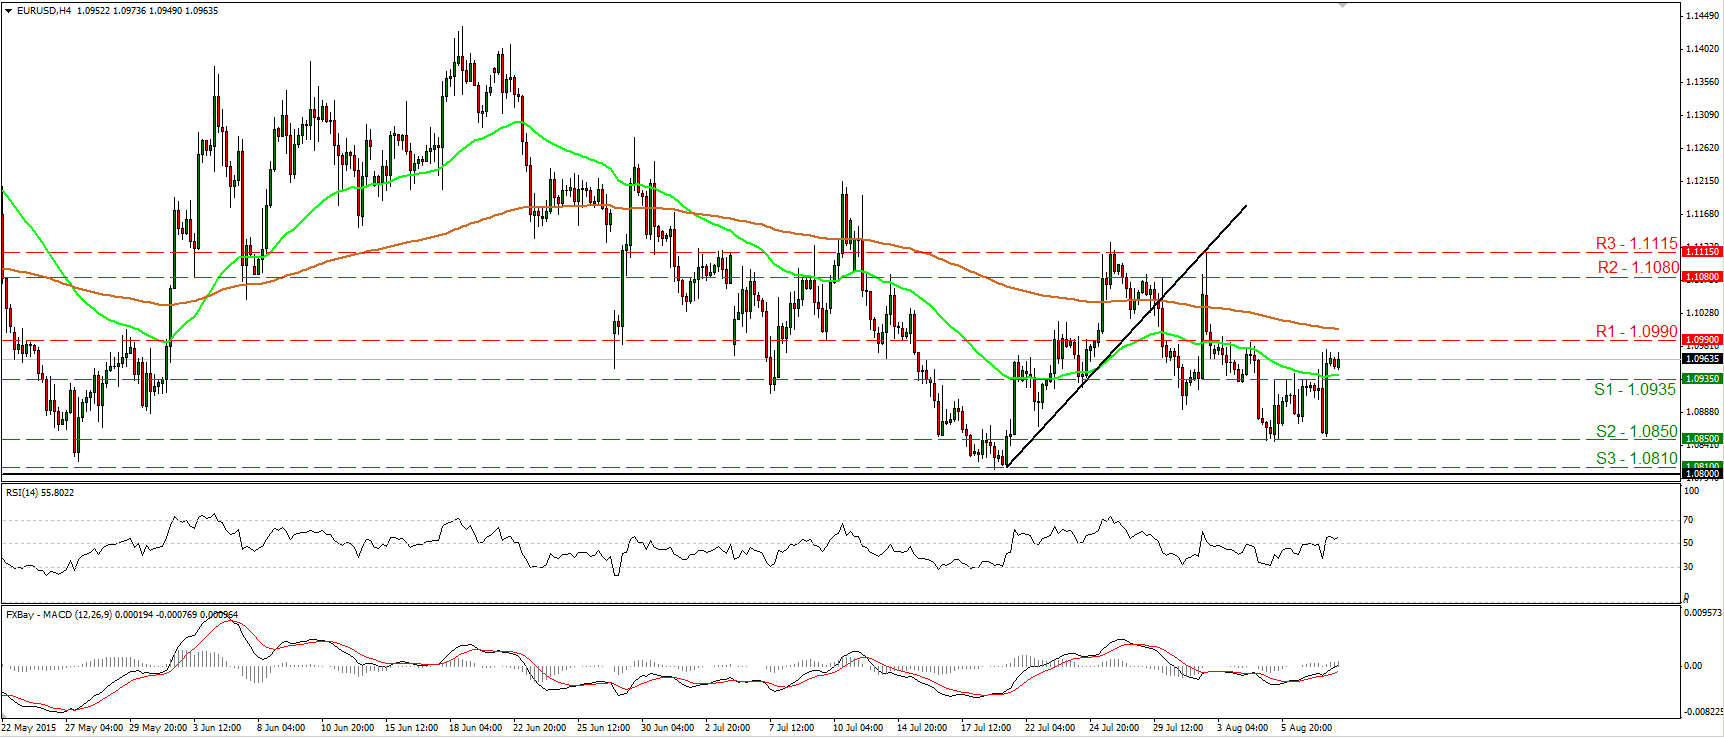
EUR/USD rebounds from slightly above 1.0850
• EUR/USD plunged on Friday after the US employment report showed that the US economy added 215k jobs in July. However, the rate found support near 1.0850 (S2) and rebounded to recover all the losses and to gain even more. The pair is now trading above the resistance (now turned into support) barrier of 1.0935 (S1), and therefore, I would switch my stance to flat for now. A move above 1.0990 (R1) is likely to shift the short-term bias positive and perhaps set the stage for extensions towards the next resistance of 1.1080 (R2). The RSI edged above its 50 line, while the MACD, already above its trigger line, has just turned positive. These indicators reveal positive momentum and increase the likelihood for EUR/USD to trade higher, at least in the short run. As for the broader trend, as long as EUR/USD is trading between 1.0800 and 1.1500, I would consider the longer-term picture to stay flat. I believe that a move above the psychological zone of 1.1500 is the move that could carry larger bullish implications, while a break below 1.0800 (S3) is needed to confirm a forthcoming lower low on the daily chart and perhaps turn the overall bias back to the downside.
• Support: 1.0935 (S1), 1.0850 (S2), 1.0810 (S3)
• Resistance: 1.0990 (R1), 1.1080 (R2), 1.1125 (R3)
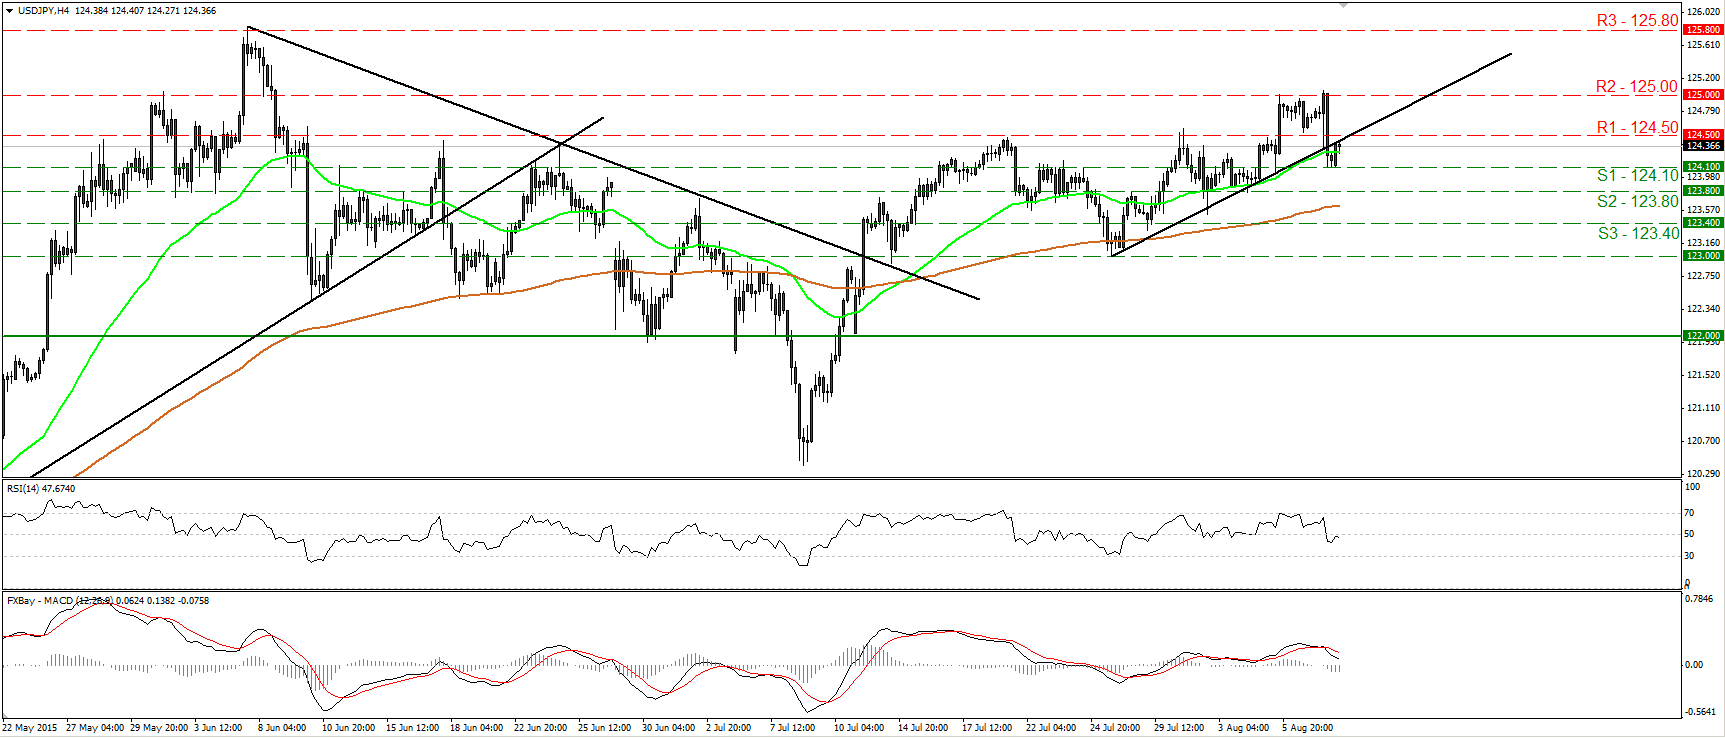
USD/JPY tumbles after hitting the 125.00 zone
• USD/JPY tumbled on Friday after it hit resistance near the 125.00 (R1) resistance territory. Subsequently, the rate fell below the 124.50 (R1) barrier and below uptrend line taken from the low of the 27th of July. I see the possibility that the pair could continue trading lower for a while. The RSI stands below its 50 line and has turned somewhat down, while the MACD, although positive, has topped and fallen below its trigger line. If the bears are strong enough to maintain their momentum, I would expect them to target once again the 124.10 (S1) support. A break below that level could pave the way for the 123.80 (S2) barrier. On the daily chart, I still see a major upside path. Therefore, I would treat any further near-term declines as corrective moves of that long-term uptrend.
• Support: 124.10 (S1), 123.80 (S2), 123.40 (S3)
• Resistance: 124.50 (R1), 125.00 (R2), 125.80 (R3)
EUR/GBP breaks out of a downside channel
• EUR/GBP continued to race higher, breaking above the upper bound of a downside channel that had been containing the price action since the 27th of July. The rate emerged above the 0.7045 (S1) hurdle and hit resistance marginally below the 0.7100 (R1) barrier. A break above that resistance is likely to have larger bullish implications and perhaps see scope for extensions towards our next resistance at 0.7160 (R2). Looking at our short-term momentum indicators, I see that the RSI rebounded from its 50 line and could now be headed towards its 70 line, while the MACD stands above both its zero and signal lines, and points north. These indicators reveal positive momentum and corroborate my view. On the daily chart, I see that on the 5th of August, the rate formed a higher low. As a result, although I would expect the rate to trade higher in the near term, I would adopt a neutral stance as far as the overall picture is concerned.
• Support: 0.7045 (S1), 0.7015 (S2), 0.7000 (S3)
• Resistance: 0.7100 (R1), 0.7160 (R2), 0.7200 (R3)
Gold still trades within a range
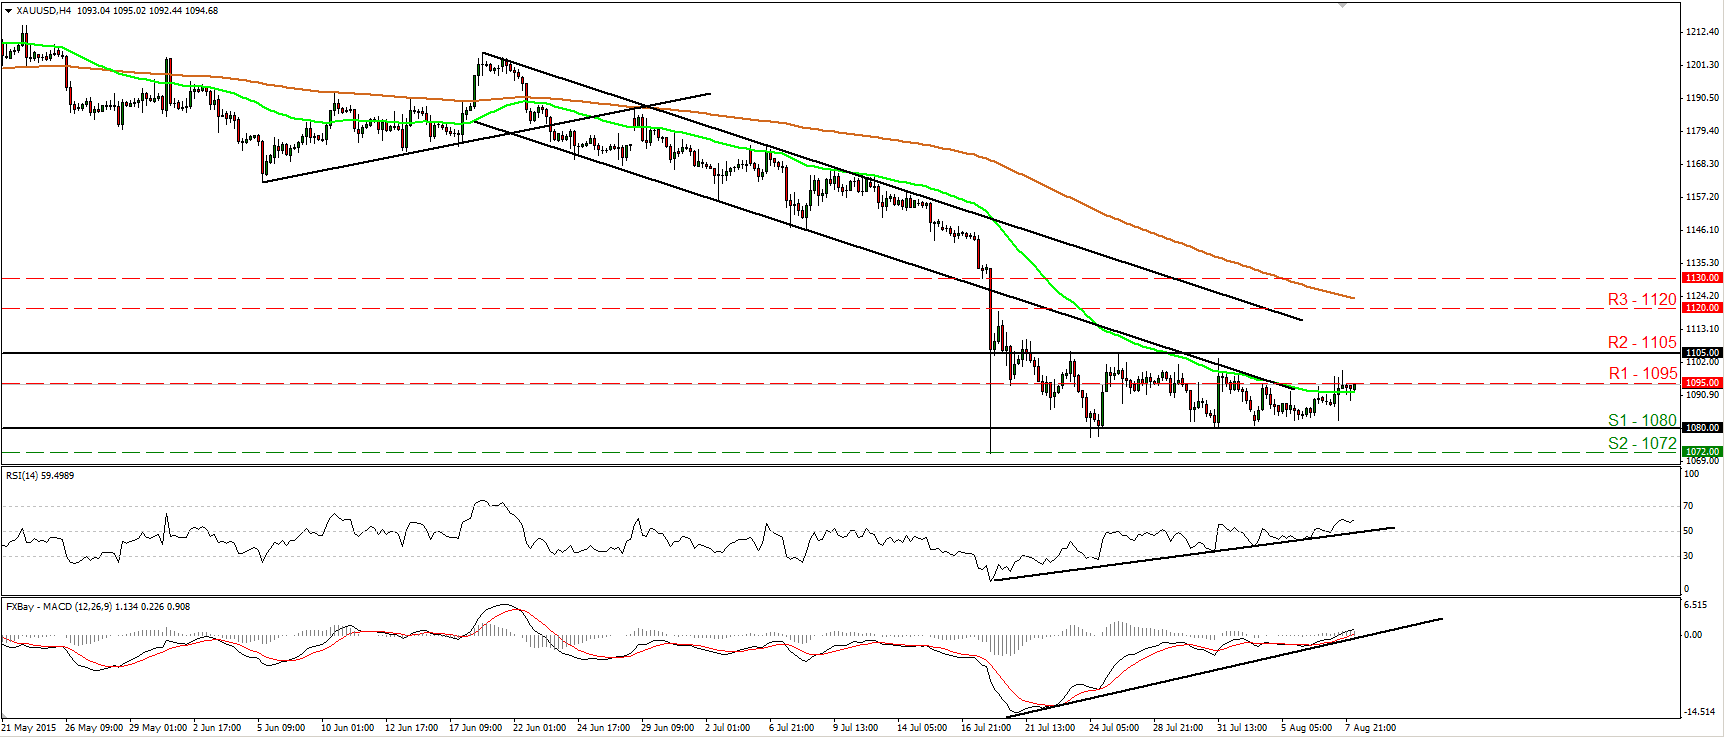
• Gold continued trading sideways, staying between the support of 1080 (S1) and the resistance of 1105 (R2). Therefore, I would consider the short-term picture to stay neutral. A break below 1080 is needed to shift the short-term bias to negative and perhaps bring into play the 1072 (S2) barrier marked by the low of the 20th of July. On the upside, a break above 1105 (R2) could turn the picture somewhat positive and could open the way for the 1120 (R3) hurdle. Our short-term oscillators reveal positive momentum and support the possibility that the metal could trade higher for a while, at least for another test at 1105 (R2). The RSI stands above its 50 line and points up, while the MACD, already above its trigger line, has obtained a positive sign. What is more, there is positive divergence between both these indicators and the price action. In the bigger picture, the plunge on the 20th of July triggered the continuation of the longer-term downtrend and this keeps the overall bias of the yellow metal to the downside in my view.
• Support: 1080 (S1), 1072 (S2), 1060 (S3)
• Resistance: 1095 (R1), 1105 (R2), 1120 (R3)
WTI reaches 43.35
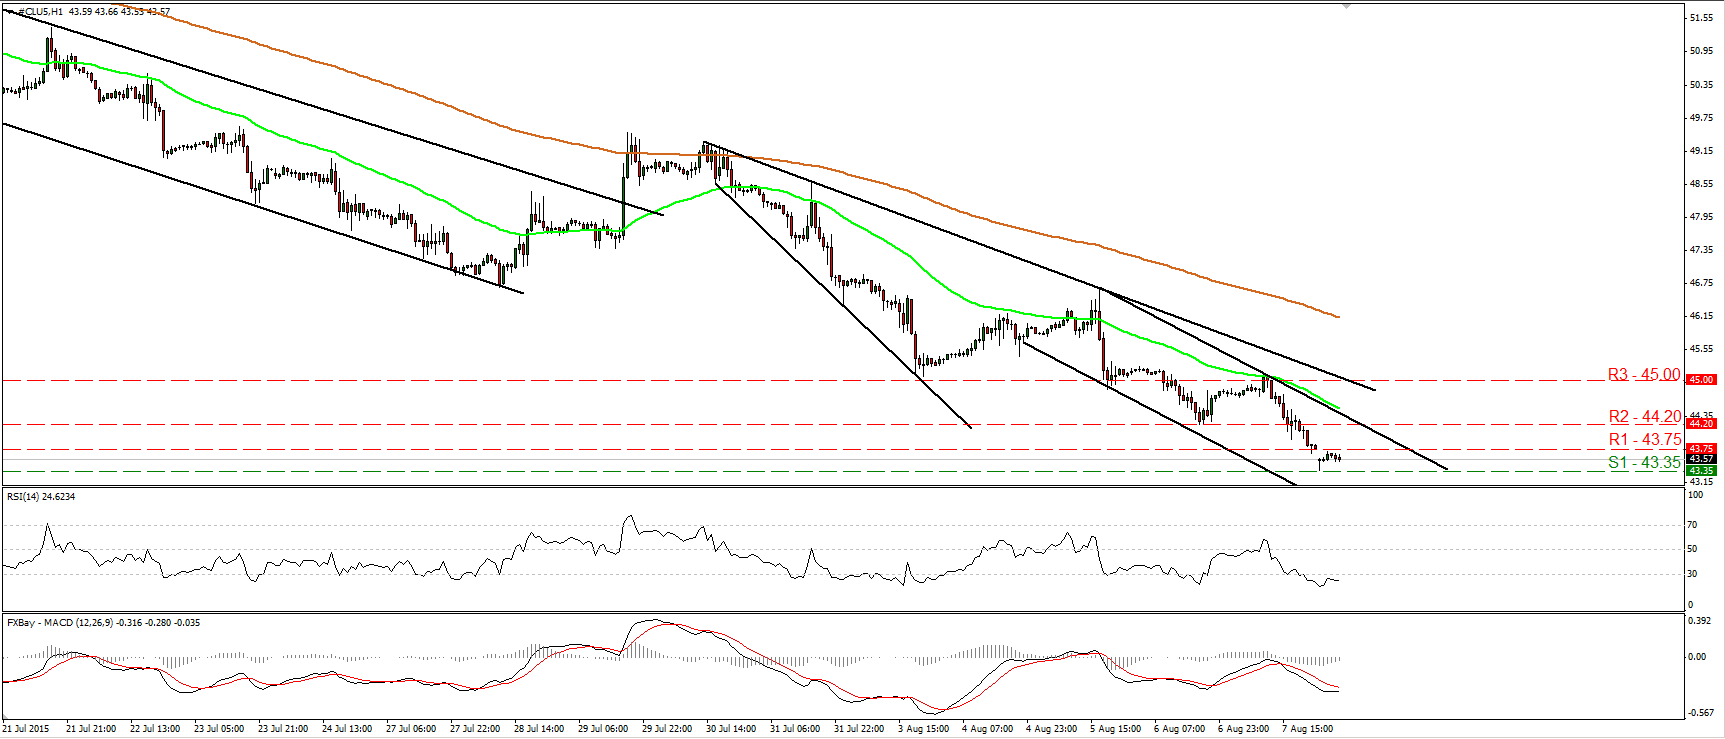
• WTI traded lower on Friday and managed to hit support at 43.35 (S1). The short-term outlook remains negative and as a result, I would expect a move below 43.35 (S1) to open the way for the 42.00 (S2) zone. Our hourly oscillators detect strong downside speed and amplify the case that WTI could continue to trade lower. The RSI stands below its 30 line and points down, while the MACD lies well below both its zero and signal lines. However, the MACD points sideways. It could be bottoming and could cross above its signal line soon. This shows that a minor corrective bounce could be looming before the next leg down. On the daily chart, in the absence of any major bullish reversal signals, I would consider the longer-term trend to still be to the downside. Therefore, I would treat any possible near-term advances as corrective moves providing renewed selling opportunities.
• Support: 43.35 (S1), 42.00 (S2), 40.00 (S3)
• Resistance: 43.75 (R1) 44.20 (R2), 45.00 (R3)

