• Back in June, the Fed was still on track to tighten later this year The minutes of the mid-June FOMC meeting revealed that the Fed was still on track to begin raising interest rates later this year, although there was no urgency and the view was that the risk of tightening too early was greater than the risk of tightening too late. “Most participants judged that the conditions for policy firming had not yet been achieved; a number of them cautioned against a premature decision,” according to the minutes. One member was even ready to hike rates at that meeting. However that was June 17th, before Greece went to the brink, the Shanghai stock market fell 28% and the May payrolls were revised down by 26k. The Committee members may not be thinking the same as they were then. In any event, the minutes were deemed dovish and Fed funds rate expectations fell a further 4-5 bps
• Fed Chair Janet Yellen will be speaking on the economic outlook tomorrow, and then will deliver her semi-annual congressional testimony next Wednesday and Thursday. Markets will put a lot more weight on what she has to say now, particularly if Greece is booted out of the euro-zone/EU this weekend. Assuming that the global financial system hasn’t collapsed, I still expect the Fed to start raising rates in September, but the market sees only around a 50% chance of a hike by then.
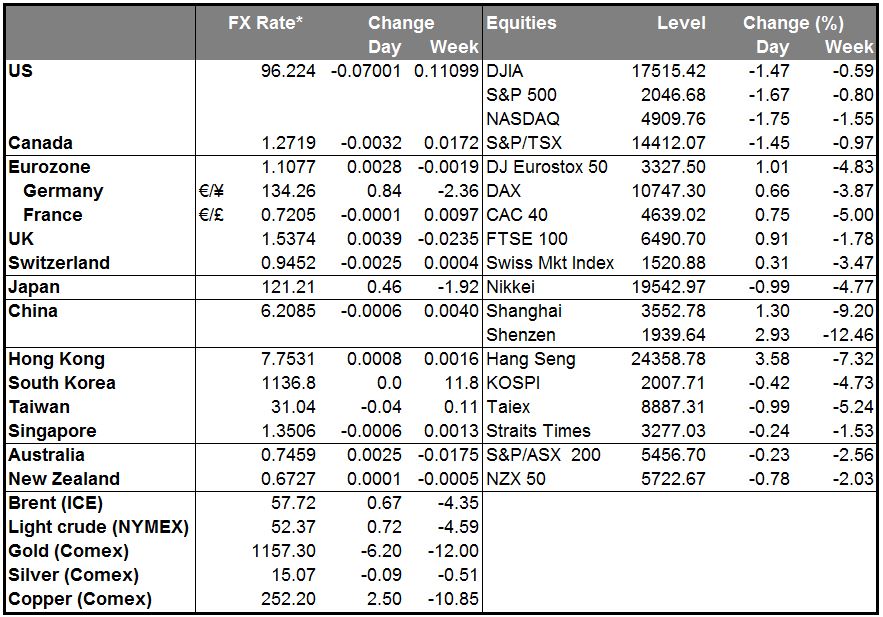
• Commodity prices rebound as Chinese stocks stabilize There was a total reversal in the commodity markets yesterday, with all the base metals and energy markets and most soft commodities rising. Precious metals were the only losers. Apparently, the fact that the Chinese government continues to unveil more and more market support measures has given some people hope. The Shanghai market was up 1.3% this morning and Shenzhen up 2.9%, not much after a near-30% fall, but up is up.
• About 70% of China’s stock market has been frozen, with more than 1,300 companies halting or suspending share trading. It’s notable that most of the suspensions happened at the request of the companies themselves. That’s apparently because many small/mid-cap stocks, especially ones with a limited free float, used their own stock as collateral to obtain bank loans. Following this sharp decline, the banks could now call the loans and start unwinding the collateral. If that happens, it will only add to the unwind of margin lending positions to cause a real collapse in share prices. However, the news that turned things around Thursday is that banking regulators announced that they will allow banks to roll over loans backed by shares and adjust their collateral requirements in order to limit the contagion from falling prices. That has acted as a circuit breaker and helped the market to stabilize, at least temporarily. I still expect that investors will unwind their leveraged bets on the market, but with fewer forced sales, it may be a slower process and the sales may be more easily absorbed.
• China wholesale, retail inflation going in different directions China’s CPI rose 1.4% yoy in June, accelerating from 1.2% in May and faster than expected, but the PPI fell 4.8% yoy, also faster than -4.6% in June. The rise in the CPI hints at some upturn in consumer demand, but it’s questionable how long that will last with so many people getting margin calls.
• Greece: no news is bad news Not much to report about Greece today. That’s not good, because with the deadline so close, they should be making more progress. The country has formally requested a three-year loan from the European Stability Mechanism, while extending the bank holiday and capital controls. PM Tsipras made a speech in the European Parliament in which he pledged to submit today the “credible” reforms that Greece’s creditors have been pushing for, but gave no details. The proposals are due in Brussels by midnight today. The big question remains: in order to satisfy the creditors, he’ll have to make deeper cuts than in the previous proposal, but that would run counter to the referendum, in which the voters rejected the previous proposal as too harsh. One way out of this conundrum might be if the creditors offered long-term debt restructuring or write-offs, in which case he might decide it’s worth it to accept more short-term pain for longer-term gain.
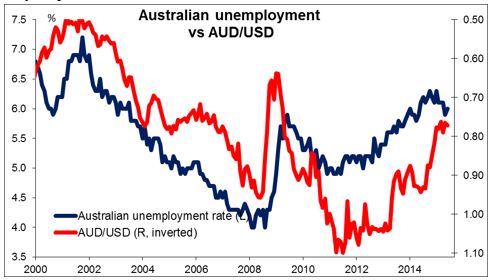
• Australia employment beats expectations The unemployment rate stayed at 6.0% in June instead of rising to 6.1% as expected, while the number of people getting jobs also beat expectations. AUD moved higher following the report, although I would think right now what’s going on in China is more important for the country than last month’s employment data.
• Today’s highlights: During the European day, German trade surplus for May fell a bit more than expected, while the current account surplus was significantly lower.
• From Sweden, the PES unemployment rate for June rose to 3.9% from 3.7%. Even though this is not a major market mover, it could show the direction of the official unemployment rate to be released next week.
• In the UK, the Bank of England holds its July policy meeting. There’s little chance of a change in policy, hence the impact on the market is likely to be minimal, as usual. The minutes of the meeting, however, should make interesting reading when they are released on 22nd of July, as members who previously voted for a rate hike have adopted a more hawkish tone recently following the upside surprise on April wage data.
• In the US, initial jobless claims for July are due to be released.
• We have several speakers on Thursday’s agenda. ECB Governing Council member Christian Noyer, Minneapolis Fed President Narayana Kocherlakota, Fed Governor Lael Brainard and Kansas Fed President Esther George speak.
The Market
EUR/USD continues higher
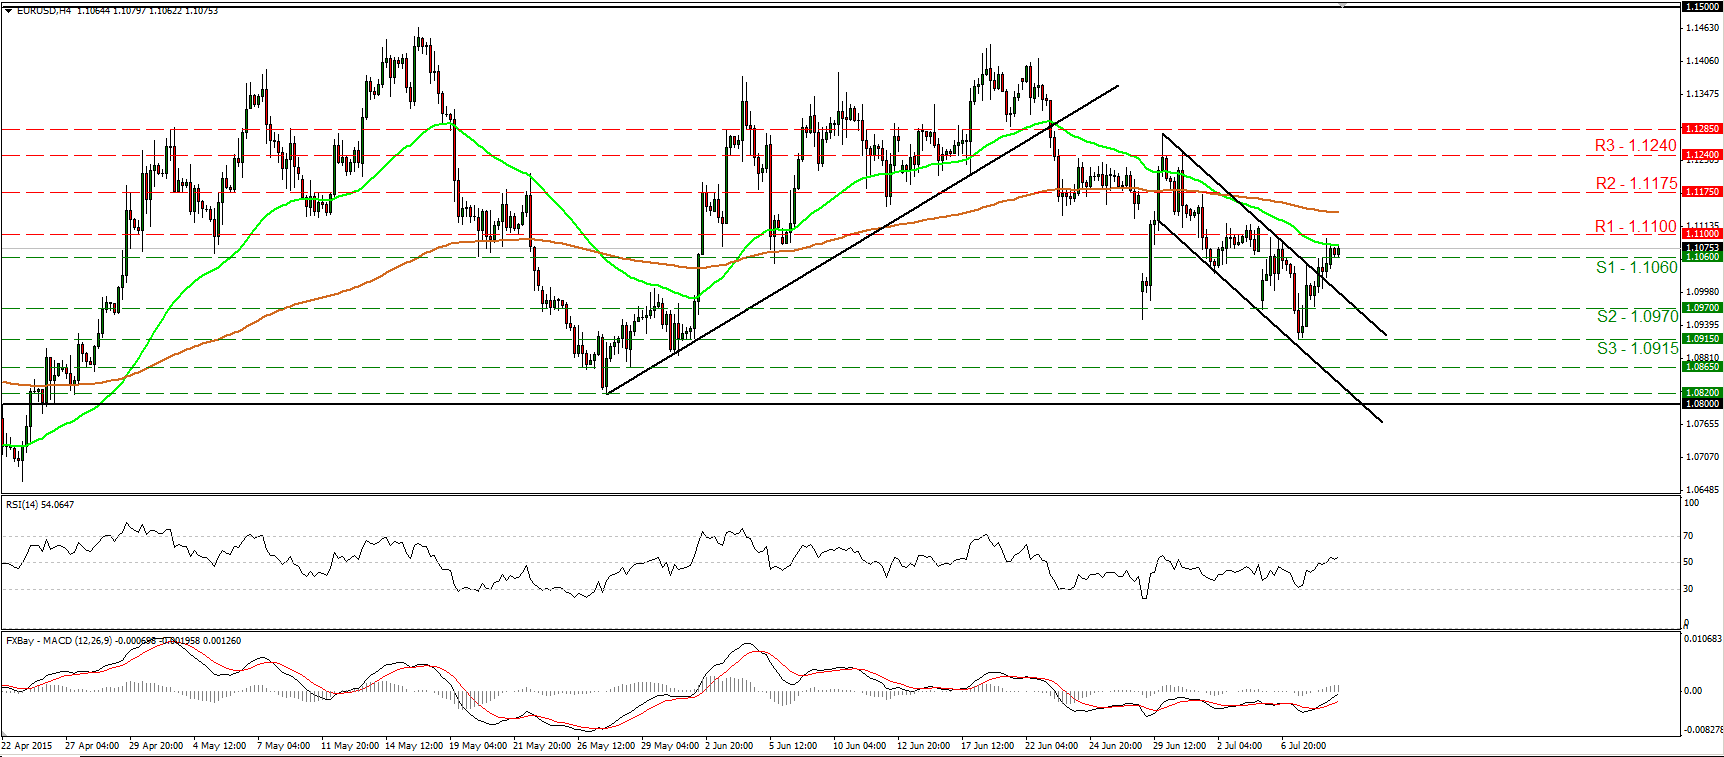
• EUR/USD continued to race higher on Wednesday. It broke above the upper line of the short-term downside channel, and is now trading slightly below the 1.1100 (R1) resistance line. A clear move above barrier could confirm a higher peak on the 4-hour chart, and perhaps turn the short-term picture somewhat positive. Something like that is likely to see scope for extensions towards our next resistance area of 1.1175 (R2). Our short-term oscillators now detect upside momentum and increase the likelihood that the rate could trade higher for a while. The RSI emerged above its 50 line, while the MACD stands above its trigger line and is headed towards its zero line. It could obtain a positive sign any time soon. I believe that a move above the psychological zone of 1.1500 is the move that could carry larger bullish implications, while a break below 1.0800 is needed to confirm a forthcoming lower low on the daily chart and perhaps turn the overall bias back to the downside.
• Support: 1.1060 (S1), 1.0970 (S2), 1.0915 (S3)
• Resistance: 1.1100 (R1), 1.1175 (R2), 1.1240 (R3)
GBP/JPY triggers buy orders at 185.00
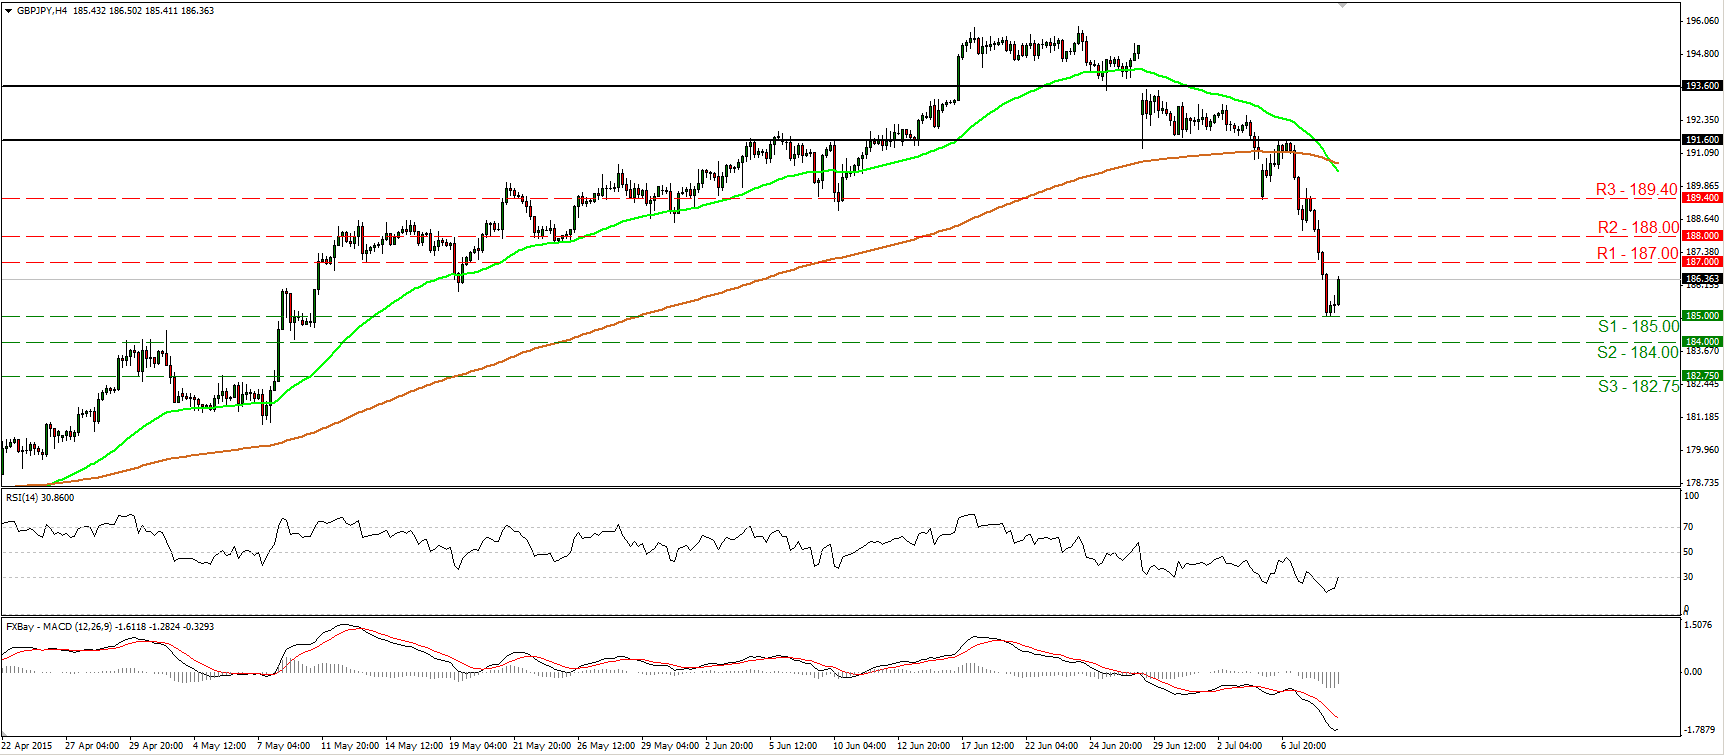
• GBP/JPY continued falling on Wednesday, but hit support at the psychological figure of 185.00 (S1) and then rebounded. Although the price structure still suggests a short-term downtrend, taking a look at our short-term oscillators, I would expect the corrective bounce to continue for a while. The RSI has bottomed and looks ready to exit its below-30 territory, while the MACD has bottomed as well and could cross above its trigger line soon. A break above the 187.00 (R1) resistance zone is likely to confirm the continuation of the rebound and perhaps challenge the 188.00 (R2) line. On the daily chart, I see that the 185.00 (S1) psychological zone stands pretty close to the 50% retracement level of the 14th of April – 24th of June rally. As a result, I would still treat the decline started on the 24th of June as a corrective move of the long-term uptrend.
• Support: 185.00 (S1), 184.00 (S2), 182.75 (S3)
• Resistance: 187.00 (R1), 188.00 (R2), 189.40 (R3)
AUD/USD trades higher after Australia’s employment data
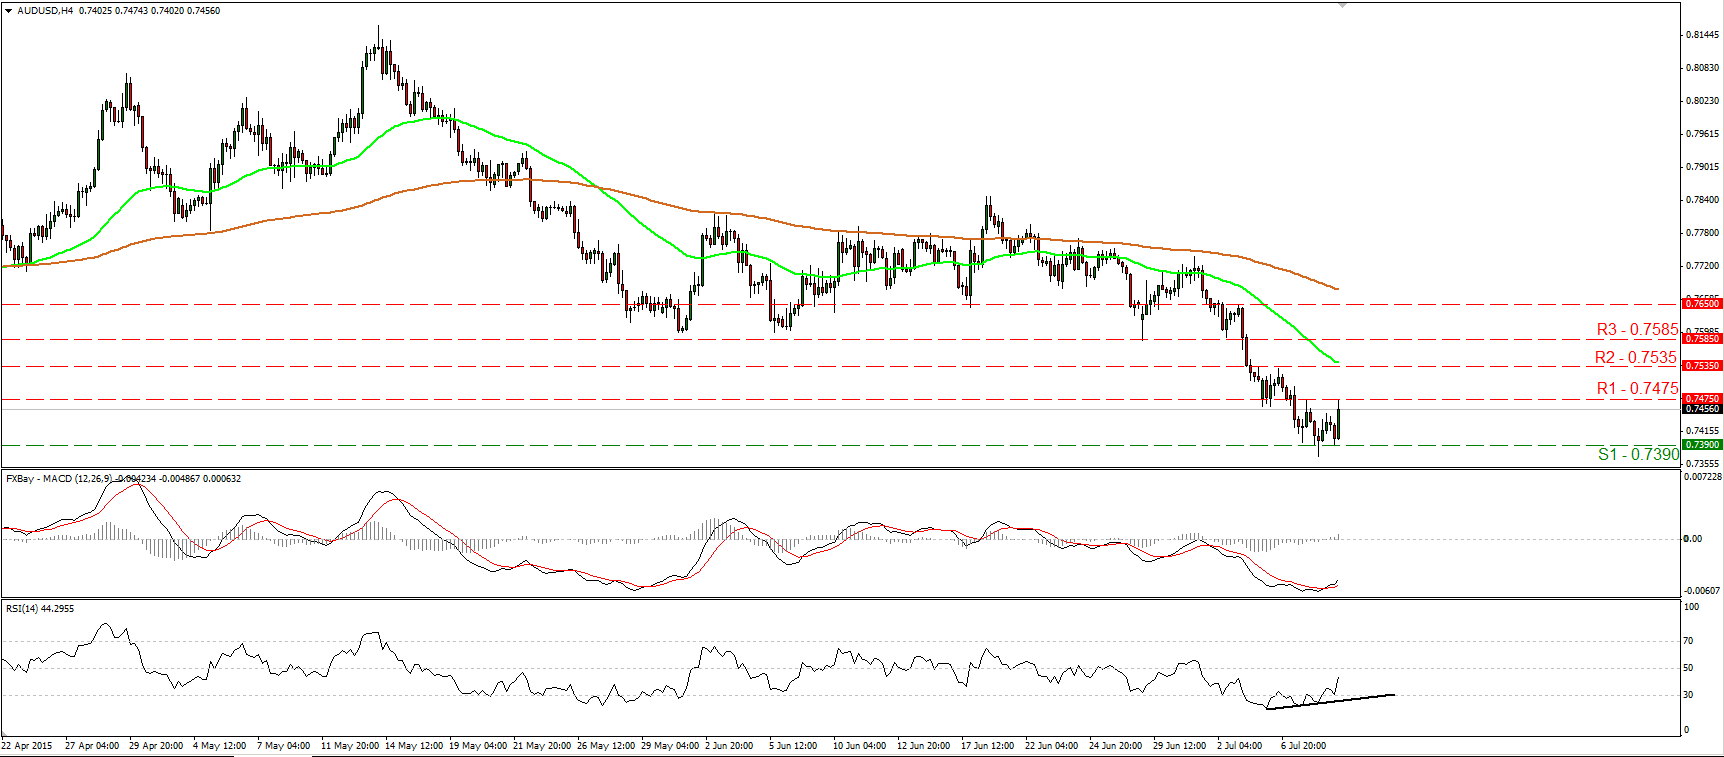
• AUD/USD traded higher during the European morning Thursday on the better-than-expected Australian employment data. The pair rebounded from the support of 0.7390 (S1) on the news to test again the resistance of 0.7475 (R1). Looking at our short-term oscillators, I see signs that the rebound could continue. The RSI raced higher after hitting its 30 line, while the MACD has bottomed and moved above its trigger line. What is more, there is positive divergence between the RSI and the price action. A clear break above 0.7475 (R1) will confirm the case and perhaps pave the way for the next resistance at 0.7535 (R2). On the daily chart, the completion of a head and shoulders formation and the move below the psychological zone of 0.7500 signaled the continuation of the prevailing long-term downtrend, in my opinion. As a result, I would treat any further short-term advances as a corrective move of that long-term downside path.
• Support: 0.7390 (S1), 0.7330 (S2), 0.7250 (S3)
• Resistance: 0.7475 (R1), 0.7535 (R2), 0.7585 (R3)
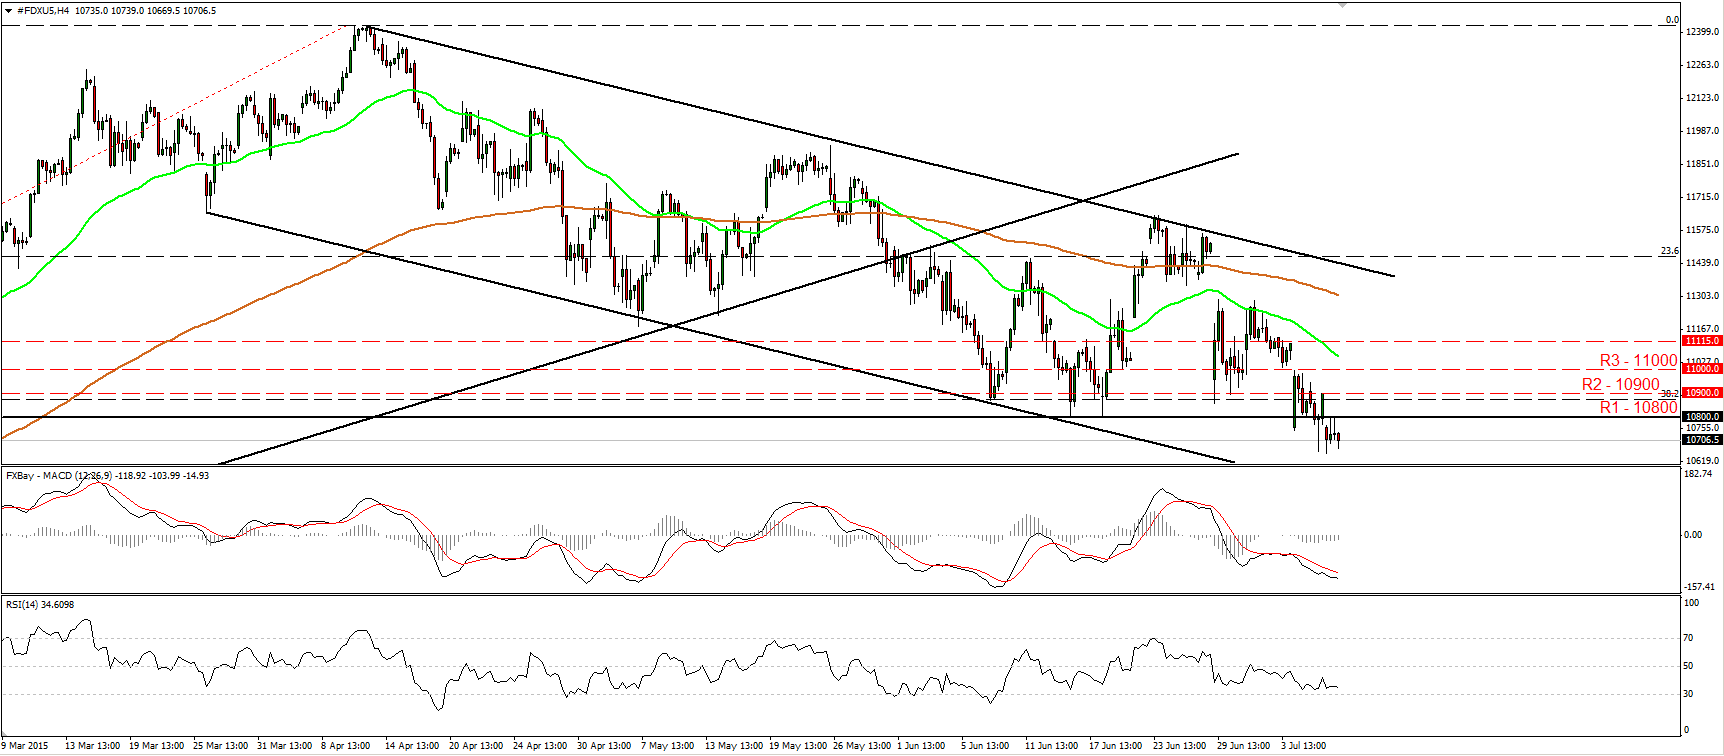
DAX futures fall below 10800
• DAX futures traded lower yesterday, breaking below the psychological zone of 10800 (R1). I would now expect the bears to continue pushing the price lower and to challenge the support area of 10600 (S1), marked by the lows of the 9th and 10th of February. As long as the index is trading below the longer-term uptrend line taken from the low of the 16th of October, and within the downside channel that has been containing the price action since the last days of March, I would consider the outlook to be negative. Our daily oscillators support the notion. The RSI raced lower and looks to be headed towards its 30 line, while the MACD, already negative, has topped and fallen below its signal line.
• Support: 10600 (S1), 10300 (S2), 10150 (S3)
• Resistance: 10900 (R1) 11000 (R2), 11115 (R3)
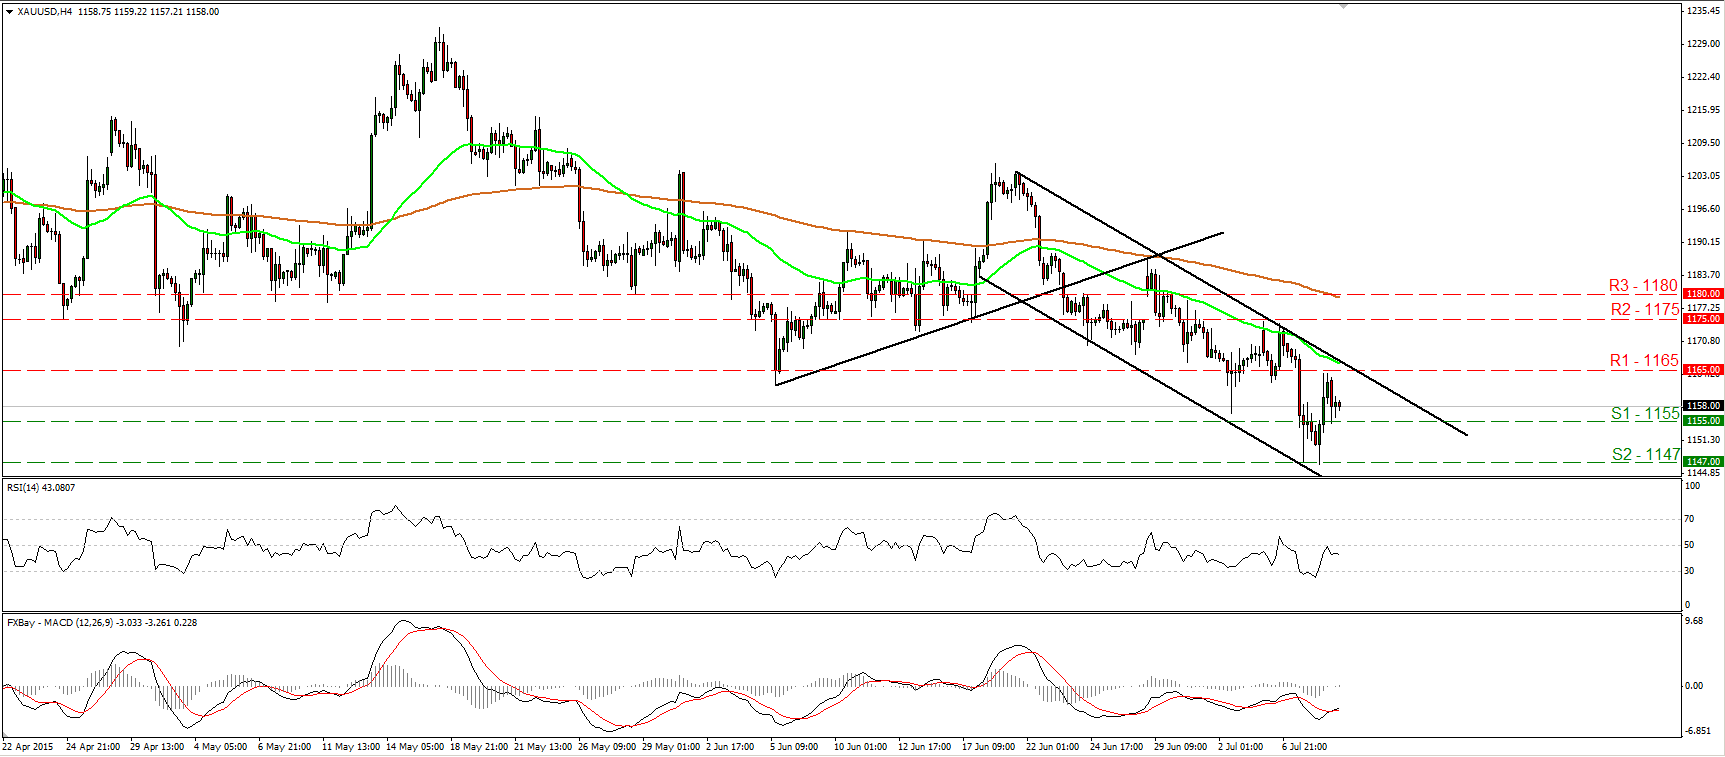
Gold hits 1147 again and rebounds
• Gold traded lower yesterday, but it once again hit the support barrier of 1147 (S2) and then rebounded to find resistance near 1165 (R1). As long as the metal is trading within the short-term downside channel, I still see a negative short-term outlook. A decisive move below the 1155 (S1) support barrier could open the way for another test at the 1147 (S2) hurdle. In the bigger picture, Tuesday’s plunge confirmed a forthcoming lower low on the daily chart and kept the overall outlook bearish as well. Our daily oscillators support the notion. The 14-day RSI continued lower and is now headed towards its 30 line, while the daily MACD lies below both its zero and signal lines, pointing down.
• Support: 1155 (S1), 1147 (S2), 1142 (S3)
• Resistance: 1165 (R1), 1175 (R2), 1180 (R3)

