Most major equity indices traded in the red yesterday, with investors staying cautious ahead of the Fed decision later in the day. We expect policymakers to stick to their dovish stance, something that may encourage participants to re-increase their risk exposure. A speech by US President Joe Biden before Congress may also attract special attention.
Equities Pull Back Ahead Of Today's Fed Outcome
The US dollar traded within a narrow range of ±0.10% against the majority of the other G10 currencies. It notably outperformed only AUD, which slid due to Australia’s disappointing inflation data, JPY, and NZD in that order.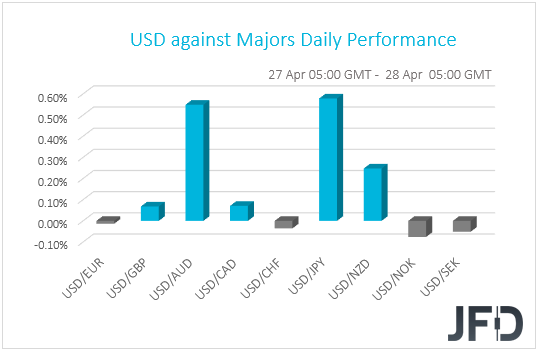
The performance in the FX sphere paints a blurry picture with regards to the broader market sentiment, and thus, in order to clear things up, we prefer to turn our gaze to the equity world. There, major EU and US indices ended their trading in the red, with the only exceptions being Spain’s IBEX 35, which gained 0.63%, and Wall Street’s Dow Jones, which finished virtually unchanged. Appetite improved, but slightly, during the Asian session today.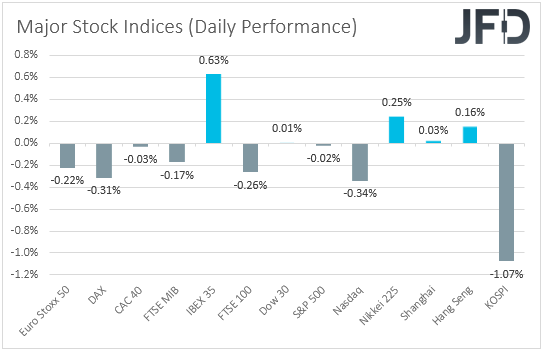
It seems that investors remained reluctant to add significantly to their risk exposure ahead of the FOMC decision later today. At the prior meeting, Fed officials decided to keep all their policy settings unchanged via a unanimous vote, noting that bond purchases will continue until substantial further progress has been made towards their maximum employment and price stability goals.
As far as the dot plot is concerned, 4 members voted for hikes in 2022, while 7 members saw rates higher in 2023, but the median dots suggested that interest rates are likely to stay at present levels even in 2023. Even though officials upgraded their economic and inflation forecasts – inflation is seen at 2.4% this year –, Fed Chair Powell clearly said that this will be temporary and would not meet their standards. He also stuck to his guns that it is too early to discuss tapering QE.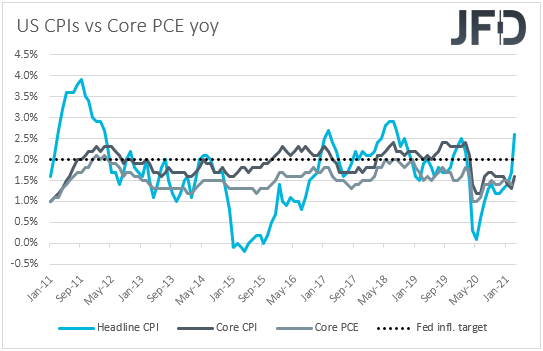
Taking all that into account, we don’t expect any policy changes at this gathering, neither a different message by policymakers. Since the previous meeting, data showed that the headline CPI rate jumped to +2.6% yoy, but we expect officials to maintain the view that this will prove to be temporary.
However, with other data suggesting that the US economy is recovering from the coronavirus-related damages at a fast pace, especially last week’s PMIs which stood above 60, it would be interesting to see for how much longer the Fed will be able to keep market participants convinced that it is still too early to put policy normalization on the discussion table.
In any case, for now, with the Fed sticking to its dovish language, we see the case for equities to rebound and drift further north, and for the US dollar and other safe havens, like the yen, to come under renewed selling interest.
Apart from the Fed decision, market participants may also pay extra attention to US President Joe Biden’s first address to a joint session of Congress, two days before he notches 100 days in the Oval Office. Biden is expected to talk about his administration’s accomplishments so far, but to also outline his vision moving forwards. According to the White House press secretary, he will lay out a new USD 1.5trln spending and tax proposal, which if bodes well with lawmakers, may fuel further investors’ optimism. Other priorities Biden may present include more access to health care and putting police reforms in place.
S&P 500 Technical Outlook
The S&P 500 index continues to slowly grind higher, while trading above a short-term tentative upside support line taken from the low of Mar. 25. Yesterday, the index once again hit a new all-time high, reaching the area near the 4199 barrier and then correcting lower. If the price continues to trade above that upside line, we will remain positive, at least in the near term.
A small corrective move lower may bring the index to the aforementioned upside line, which if holds, could attract more buyers into the game again. If so, the S&P 500 might rise back to the current all-time high, at 4199, a break of which would place the index into the uncharted territory.
On the other hand, if the previously mentioned upside line breaks and the price falls below the 4171 hurdle, marked by the low of Apr. 26, that could spook the buyers from the field for a bit. The index may fall to the 4149 obstacle, which if fails to provide support and breaks, could clear the way towards the next support area between the 4118 and 4123 levels. Those levels mark the lows of Apr. 20 and 22 respectively.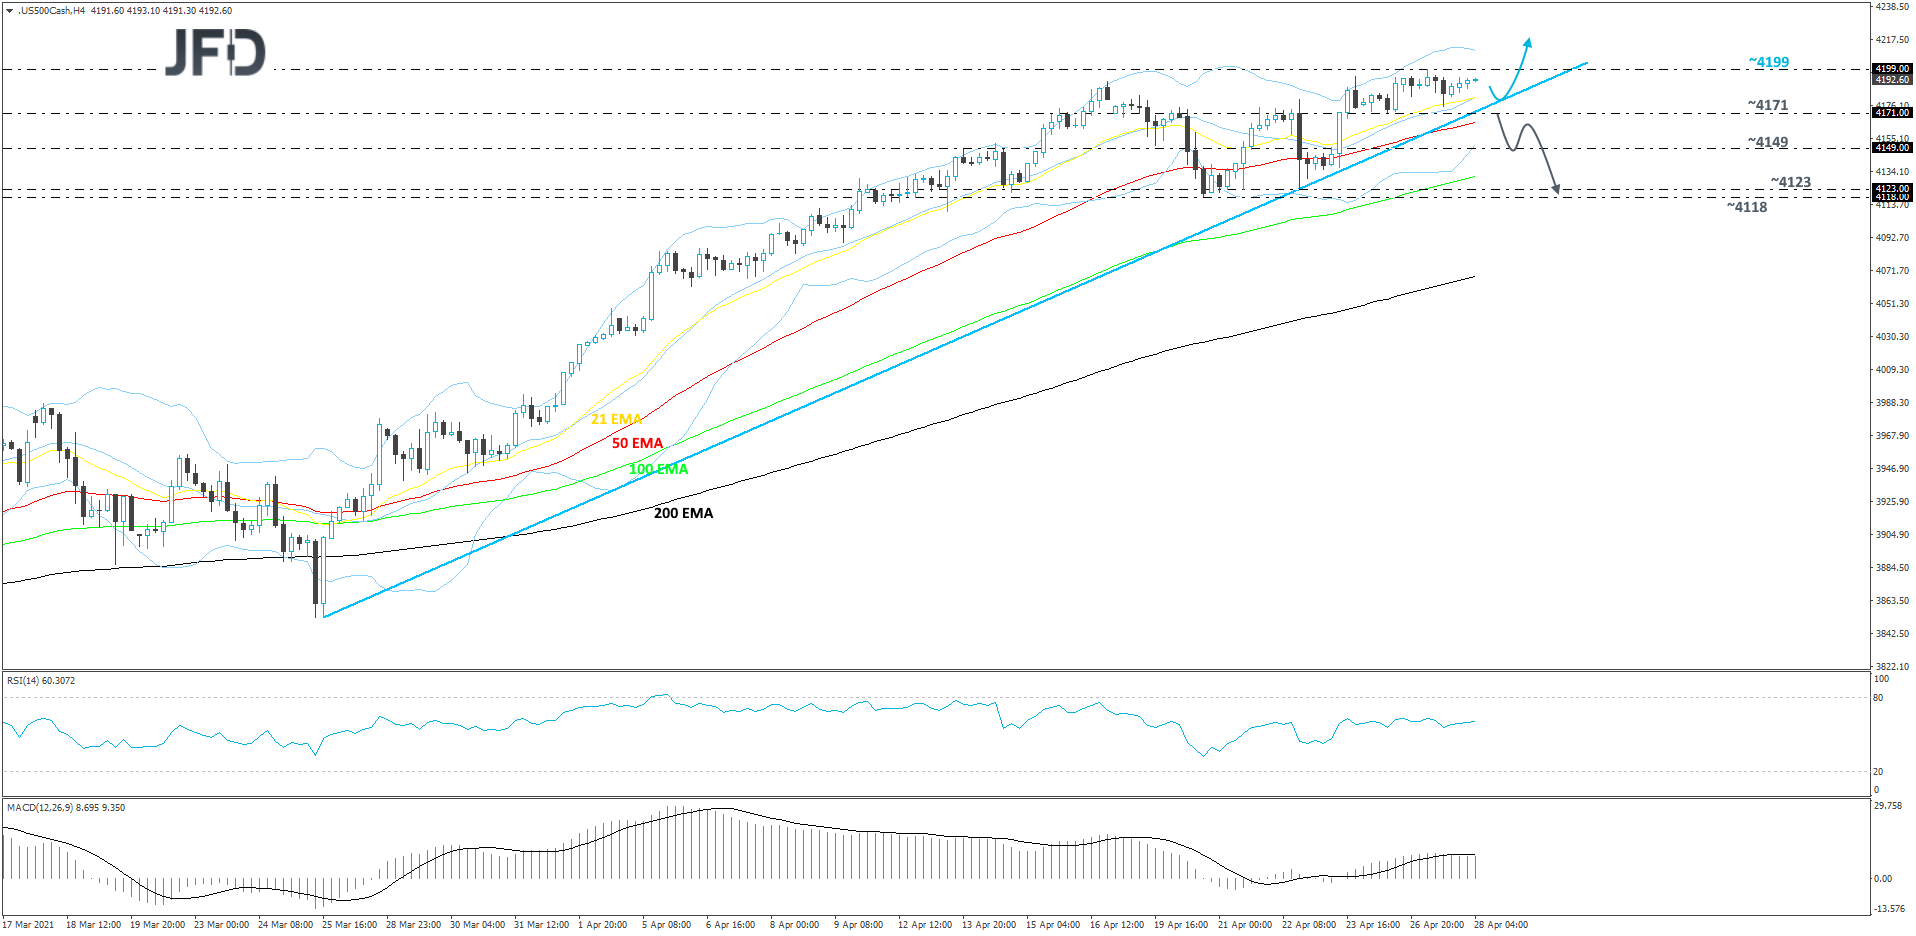
GBP/USD Technical Outlook
After a strong move higher in the beginning of last week, GBP/USD started correcting lower. Even if it drifts a bit more to the downside, as long as the rate stays above a short-term tentative upside support line taken from the low of Apr. 12, the bulls could remain interested for a while longer. We will stay somewhat positive for now.
A small drop lower could bring GBP/USD back to yesterday’s low, at 1.3858, or to the 1.3823 zone, marked by the low of Apr. 22. If the pair gets a hold-up somewhere around there, the bulls might take advantage of the lower rate and take charge again. If so, GBP/USD could travel back to the current high of this week, at 1.3929, a break of which would confirm a forthcoming higher high, potentially setting the stage for a move to the 1.3950 area, marked by the high of Apr. 22. If the buying doesn’t stop there, the next possible target might be the current highest point of April, at 1.4009.
Alternatively, if the aforementioned upside line breaks and the pair falls below the 1.3809 territory, marked by the highs of Apr. 14 and 15, and by the low of April 19th, that could change the direction of the current short-term trend, potentially opening the gates for further declines. GBP/USD may then travel to the 1.3750 obstacle, or to the 1.3715 zone, marked by the low of Apr. 16. If the selling continues, the pair might fall to the 1.3670 level, which is the current lowest point of April.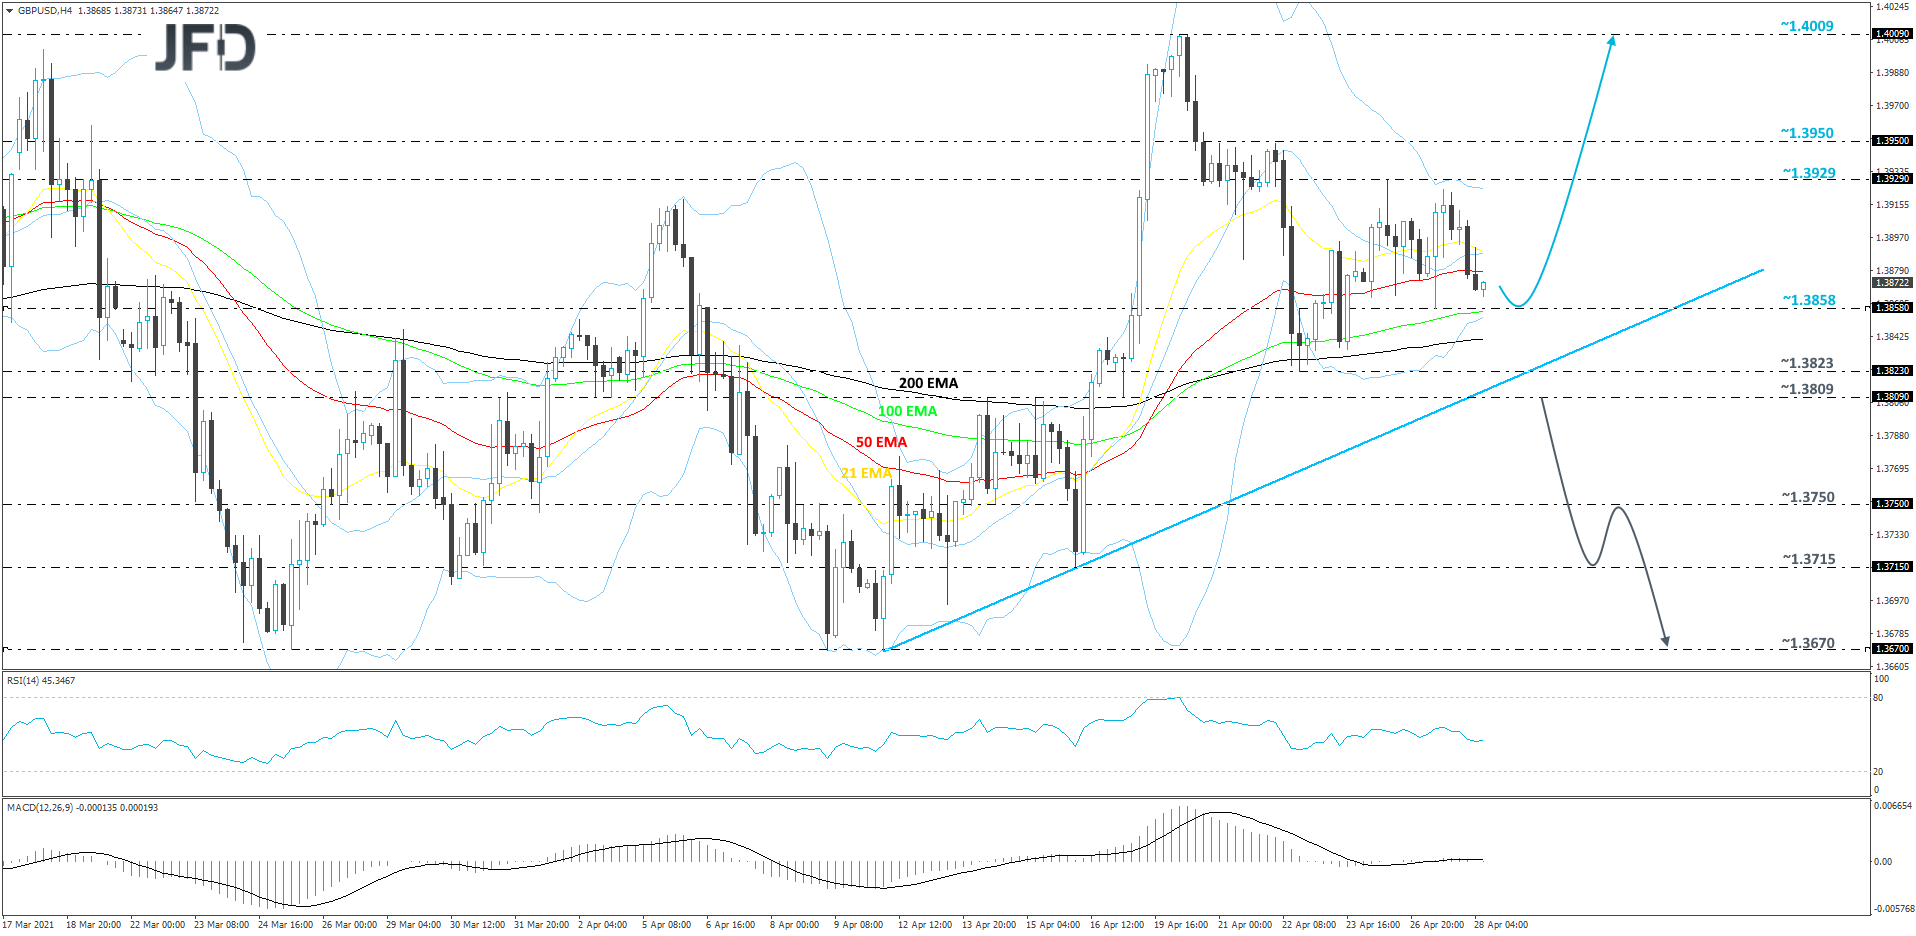
As For The Rest Of Today's Events
Besides the Fed decision and Biden’s speech, we also get Canada’s retail sales for February. Both the headline and core rates are forecast to have rebounded to +4.0% mom and +3.7% mom from -1.1% and -1.2% respectively. At last week’s meeting, the BoC decided to scale back its bond purchases and sounded very optimistic with regards to the economic outlook. So, a potential rebound in retail sales is likely to add credence to the Bank’s view and perhaps help the Canadian dollar to rise further.
With regards to the energy market, we have the EIA (Energy Information Administration) report on crude oil inventories for last week. Expectations are for a 0.659mn barrels inventory build, following a rise of 0.594mn barrels the week before. However, bearing in mind that, yesterday, the API (American Petroleum Institute) reported a 4.319mn barrels increase, we would consider the risks surrounding the EIA print as tilted to the upside.
Tonight, during the Asian trading Thursday, New Zealand’s trade balance for March and the ANZ business confidence index for April are coming out, but no forecast is available for neither release.
As for the speakers, apart from Fed Chief Powell and US President Biden, we will also get to hear from ECB President Christine Lagarde.
