Follow the money.
It’s investment advice you’ve probably heard before. But very few investors seem to follow it. It seems many don’t know what to look for... or which pieces of data are important.
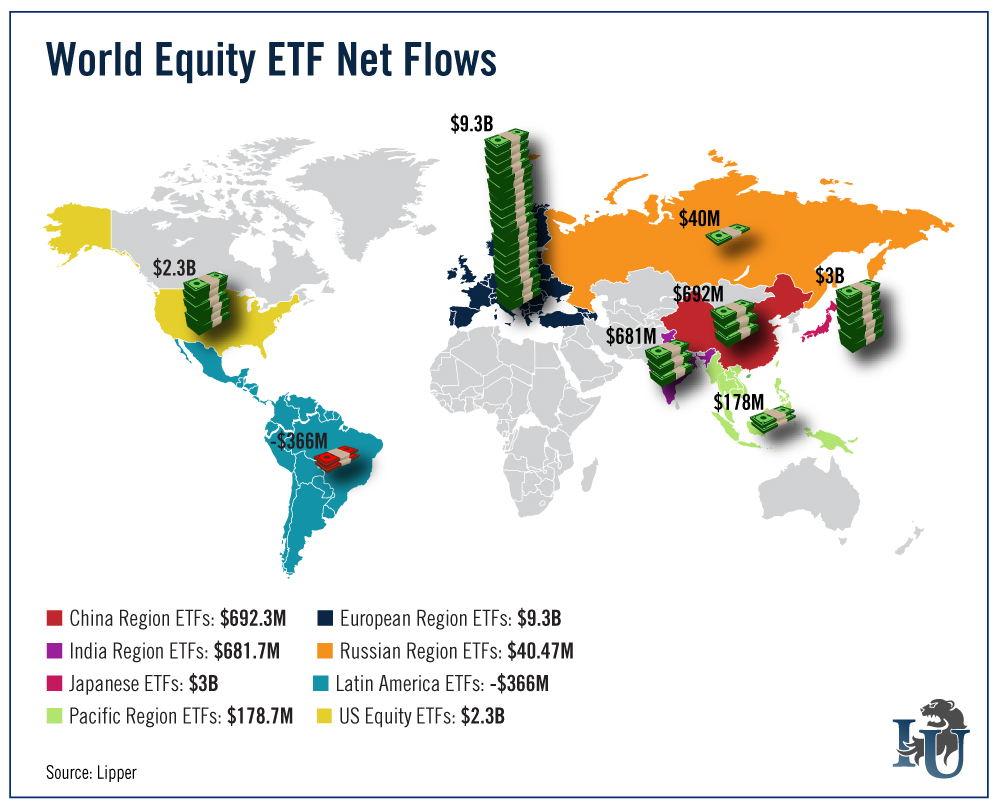
Today’s chart looks at an extremely valuable metric: net fund flows. In particular, net fund flows for equity-based ETFs around the world.
What is fund flow and what does it tell us? First and foremost, it tells us where the money is heading...
Fund flow is the net amount of cash flowing in and out of a specific asset. If someone purchases the asset, that is an inflow. And if someone sells the asset, that is an outflow.
We watch fund flows to gauge investor sentiment toward a specific sector, asset class or region. Our chart above shows investor sentiment toward different markets around the globe. To create it, we pulled the March fund flows for equity ETFs (the most recent data reported) and plotted them on a map.
As you can see, Latin American ETFs saw an outflow of $366 million. Clearly some pessimism here.
Meanwhile, investors are still feeling the love for the U.S. and Japan. Investors plowed $2.3 billion and $3 billion into these countries, respectively.
But the clear winner is the eurozone. Investors flooded the region with more than $9.3 billion in new net cash.
The biggest factor leading to increased fund flows to the eurozone is the European Central Bank’s (ECB) quantitative easing (QE) scheme. Implemented in March, the ECB’s plan is to buy 60 billion euros’ worth of government bonds each month from all over the eurozone.
This 1.1 trillion euro money dump will last until at least September 2016. The goal is to fight off the threat of deflation and boost economic activity as banks grow more confident with lending.
Will this plan fix the eurozone in the long run? That’s debatable. As Oxford Club Editorial Director Andrew Snyder recently pointed out, monetary stimulus can turn economies into QE addicts. And it can be very hard to wean these addicts off their painkillers.

Investors pouring money into Europe are betting on the shorter-term profit potential cheap money brings. And history tells us it’s a good bet.
After the U.S. financial collapse of 2008, the U.S. Federal Reserve started what would become a multitiered QE program. At its height, it was purchasing over $85 billion in bonds a month.
Between November 2008 - when the Fed began its first QE program - and October 2014, cheap money helped the S&P 500 rocket 160% higher. During that same time frame, the U.S. market outperformed European markets (measured by the STOXX Europe 600 Index) by over 53.7%.
But since the U.S. has come off life support, the story has changed. With the ECB’s QE program at full gallop, European markets are up 17.85% year-to-date. Meanwhile, the S&P 500 is up only 2.72%.
Bottom line: Money is flowing into the eurozone as its QE machine begins to fire on all cylinders. Investors should take note and consider diversifying into European stocks.
