The FOMC meeting has passed, and the wash-out is that we have seen a cap on the recent widening of interest rate expectations (through the rates market), and a better bid in Treasuries.
The removal of ‘accommodative’ in the Fed’s statement, with regards to their stance on monetary policy, was, without doubt, the talking point on the floors, and given the ‘dots’ plot projections were left unchanged has been taken as somewhat of a dovish hike by the market. That is, relative to lofty expectations that had recently been priced in. So, monetary policy in the US is further closer towards a more neutral setting, even if it is not restrictive by any means, and we see a further hike in December as the base-case, with close to an 80% probability priced into the swaps market.
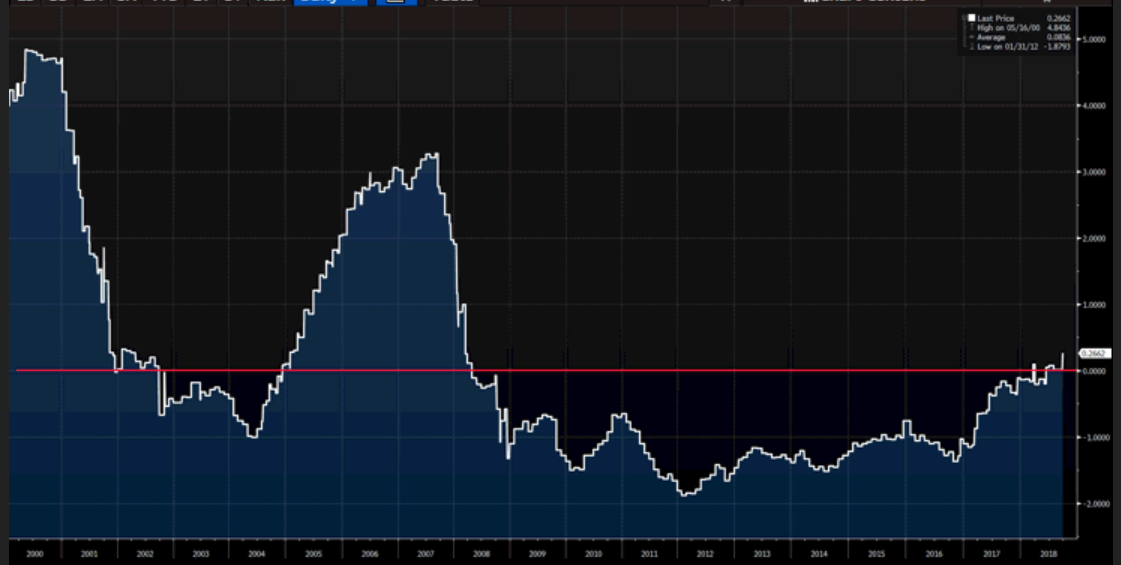
Governor Powell did try to smooth over the change to ‘accommodative’ and pushed the notion to not over-interpret this change, but there is still some confusion here. When we take a step back and look at the fed funds rate on a ‘real’ basis (or adjusted for core PCE) we can still see that real interest rates are now convincingly positive for the first time since May 2008, and this should represent a tightening of financial conditions, even if on the whole US financial conditions are still favouring taking on risk in portfolios.

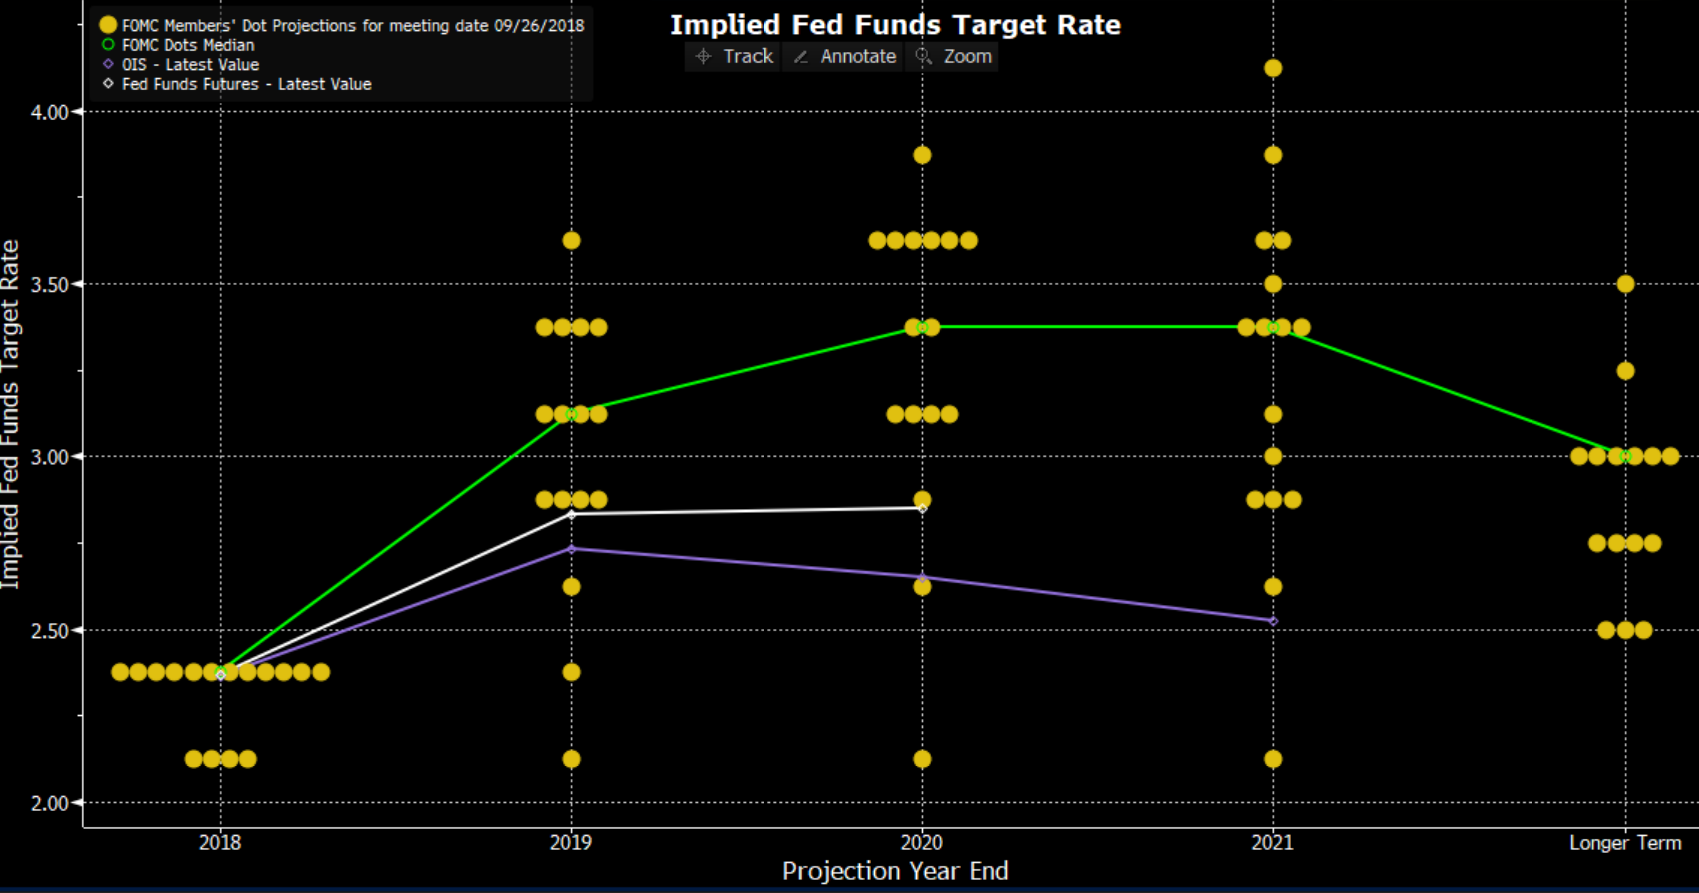
The ‘dots plot’ projections, or where the Fed collective (if we use the median estimates) see the fed funds over a certain period, still have three hikes coming in 2019, one in 2020, with no hikes seen in 2021. Their long-run neutral rate has firmed at 3%, with the introduction of Richard Clarida aiding that. However, it’s the projections for 2021, which were added for the first time, that interests here. Here, when we look at the distribution of estimates (from fed members) the median suggests no hikes in 2021, but it conceals what is a huge debate within the board, with four members calling for rates to head above 3.5%, while there are six calling for the funds rate to be below 3%. It's not hard to see why we have seen a move in the US interest rate markets to price out rate hikes, with the level of implied hikes seen between December 2018 and December 2020 falling three basis points to 51.5bp (if we eye Eurodollar futures).

We can also see the US Treasury yield curve flattening by three basis points (bp) and at 22bp suggests that we could be seeing a resumption of a flatter yield curve. Perhaps this will come on the radar as a market theme again, primarily driven by outperformance of longer-term rates and whether this pushes capital out of the USD is a factor we should watch. Indeed, the reaction in the S&P 500 to the views of the Fed and Powell’s statement was to sell US financials (the S&P 500 financial sector closed -1.3%), which resulted in the S&P 500 headed lower into the close to finish -0.3%. This should weigh on Asia today, and we see the ASX 200 and Nikkei 225 opening 0.4% and 0.7% lower respectively, although China may buck this trend,
The USD has had a mixed night, with the purest read predictably seen against the JPY, with USD/JPY tracking the US 5- and 7-year Treasury lower, with the US 10-year Treasury closing 4bp lower at 3.05%.
Trading around key announcements is for the bravest of souls, and we always suggest limiting exposures to an event which can throw up surprises outside of your control. With that in mind, if we look at the USD index, moves have been all over the place, with the USD falling into 94.10 before rebounding as Powell spoke and we see the USD slightly higher, with most of the move seen against the EUR. EUR/USD longs are still on the radar, but only when price closes through the 1.1800/1.1820 level, a situation which would tell us the market is ready to push the pair higher from here.
AUD/USD pushed into $0.7315 in the wake of the Fed statement but has been offered since and perhaps there has been an element of good-will that has resonating in the AUD from a solid performance from emerging market currencies, with good buying seen in the ZAR, BRL and TRY. Watch price action in upcoming trade, as we have seen a ‘doji’ candle printed on the AUDUSD daily chart, and a lower low today would suggest the pair is ready for a move toward the 72-handle again. One to watch, although this pair could find inspiration from USD//CNH today, although this correlation has broken down somewhat of late.
The CAD has seen sellers, but this is perhaps a better reflection of NAFTA commentary, with Trump that he’s not happy with Canada and a deal is unlikely before 30 September. We can also throw in a 0.7% sell-off in US crude as CAD negative. Happy to be a buyer in small size of USD/CAD on a break of the 18 September high of 1.3065.
