Last week, as the Fed wrapped up its annual Jackson Hole confab, the markets sold off following suggestions the Fed might just hike rates in September after all. On Monday, the markets rallied to recover a majority of that lost ground keeping the markets confined within the very narrow, low volatility range that has existed for the last 35 trading days.
I discussed in this past weekend’s missive the likely range of outcomes that currently exist. (Charts updated through Monday’s close.)
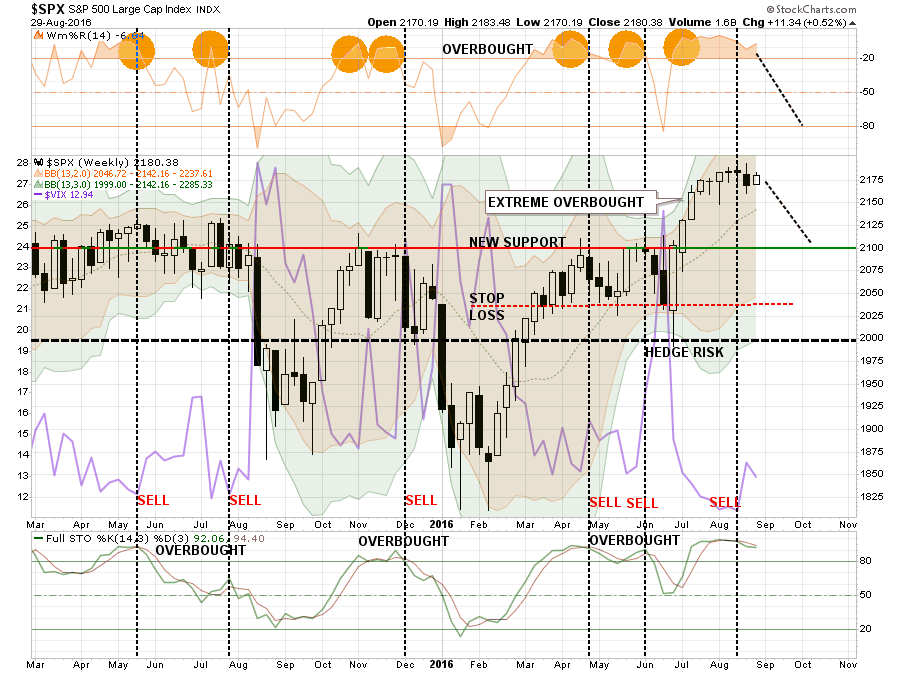
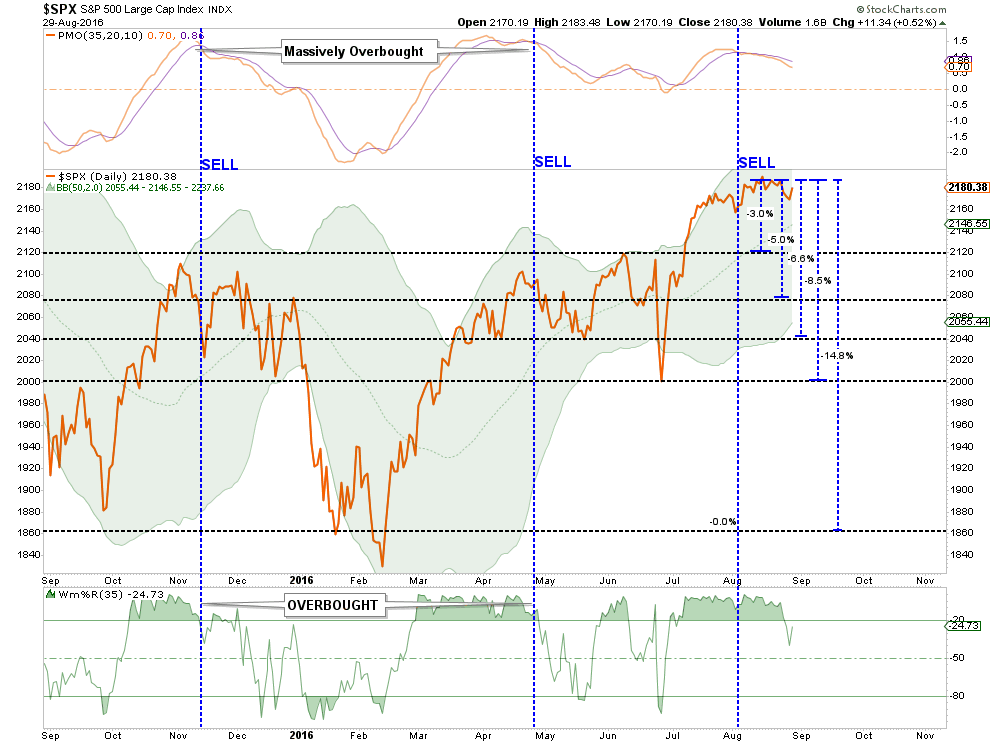
The weekly full-stochastic indicator as shown in the chart below has issued a ‘sell signal.’ Combined with the volatility index turning up from extremely low levels, it suggests a near-term potential for a continued corrective action.
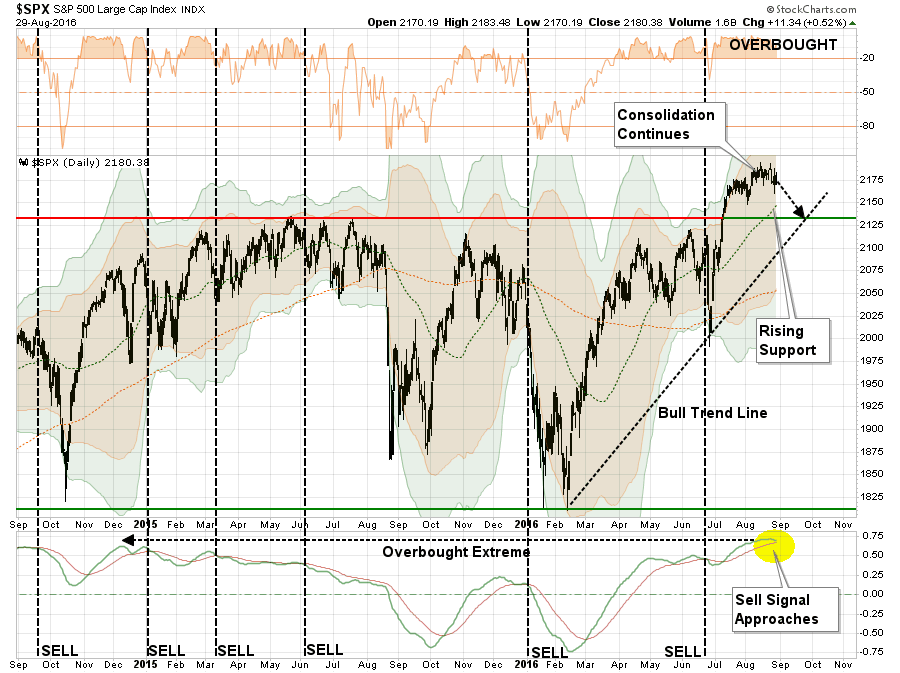
The chart above is also being confirmed by a short-term momentum “sell signal” from very high levels, which has historically led to short-term pullbacks or deeper corrections.
Of course, following the “Brexit” surge as Central Banks rushed to infuse capital into the markets to offset a “crisis that didn’t occur,” the market has remained in suspended animation over the last several weeks.
With the markets, on a short-term basis, remaining in overbought territory, there is little “fuel” presently available to push the prices higher currently. Therefore, downside risk outweighs the potential for upside returns in the market currently.
What September Bringeth
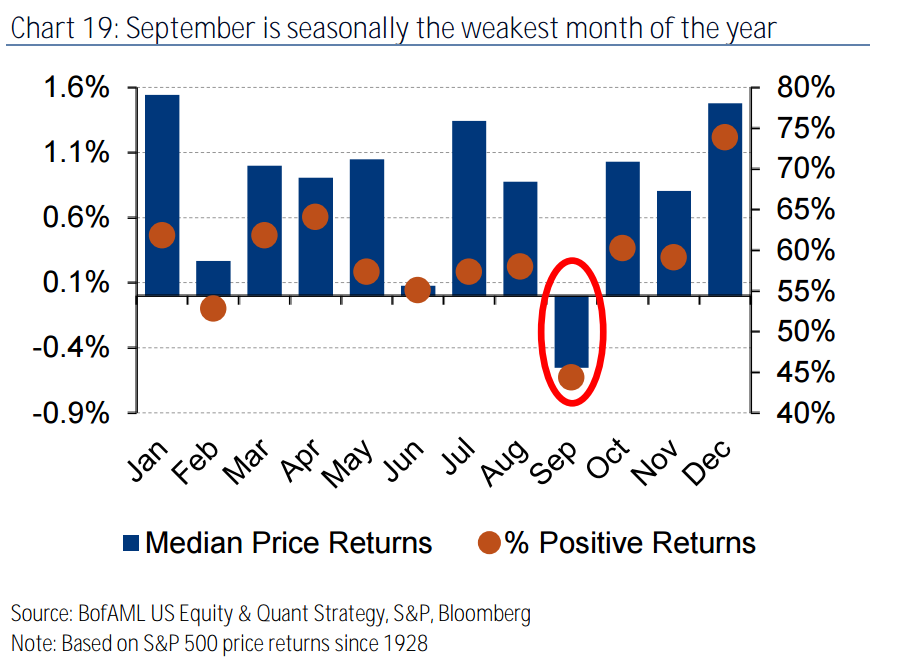
BofAML wrote last week:
History is working against the market. September is typically the weakest month of the year; since 1928, the S&P 500 has dropped in September 56% of the time.
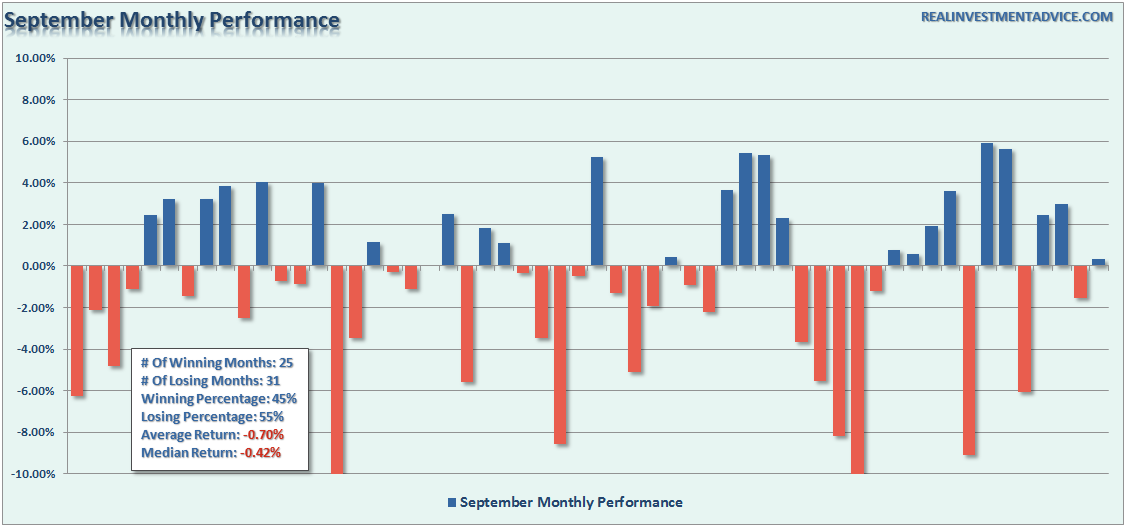
We can confirm BofAML’s point by looking at the analysis of each month of September going back to 1960 as shown in the chart below.
As shown, the average return for all months of September is -.70% with a median return of -.42%. More importantly, the statistics for September are universally negative. The number of losing months outweighs winning months by 31 to 25 which gives September a 55% chance of being negative historically speaking. While the “average and median” losses are less than 1%, this analysis obscures the fact that many September months registered losses of greater than 3%.
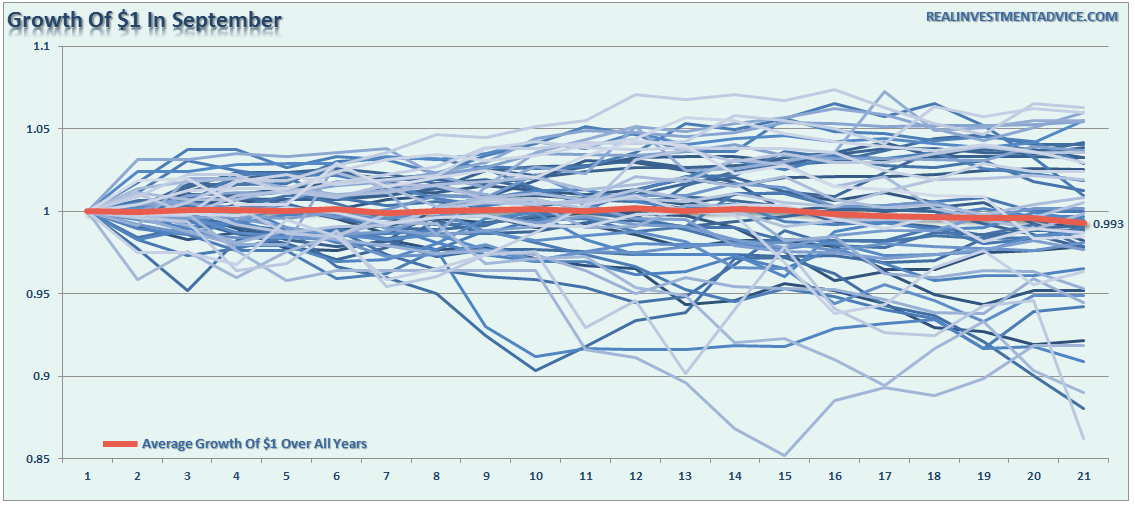
The chart below shows the daily growth of $1 invested at the beginning of September going back to 1960 with the average growth of $1 of all Septembers in red.
As Donald Trump would say: “Not so good. Not so good.”
The current consolidation of the market will end and it will likely end within the next 30 days. Given the high-levels of complacency, low volume, overbought conditions and the triggering of short-term sell signals, I would have lean towards a break to the downside. This is especially the case if the Fed does follow through with a rate-hike in September, which could disrupt the markets as we saw in January of this year.
I have laid out a series of potential correction levels. Given the current levels of bullish support for the markets, I don’t expect a deep correction prior to the election. The most likely correction process in September would be a decline back to the previous market highs or previous support at 2080. While a 3-5% correction does not seem like much, it would be enough to work off the current overbought conditions of the market allowing for a safer entry point to increase equity exposures. A “worst case” correction currently would likely be an 8.5% drawdown from the recent peaks back to major support. Of course, for most individuals, even such a small correction would likely feel far more damaging.
The bottom line is there is a real possibility of a correction developing over the next 30-days. While I don’t expect a “major market correction” to begin next month, the risk of a deeper than expected “sell off” does exist. The risk/reward ratio continues to remain negative currently. Caution remains advised.
Why Rates Are Going To Zero
I have been discussing over the last couple of weeks why the death of the bond bull market has been greatly exaggerated in recent months. To wit:
There is an assumption that because interest rates are low, that the bond bull market has come to its inevitable conclusion. The problem with this assumption is three-fold:
- All interest rates are relative. With more than $10-Trillion in debt globally sporting negative interest rates, the assumption that rates in the U.S. are about to spike higher is likely wrong. Higher yields in U.S. debt attracts flows of capital from countries with negative yields which push rates lower in the U.S. Given the current push by Central Banks globally to suppress interest rates to keep nascent economic growth going, an eventual zero-yield on U.S. debt is not unrealistic.
- The coming budget deficit balloon. Given the lack of fiscal policy controls in Washington, and promises of continued largesse in the future, the budget deficit is set to swell back to $1 Trillion or more in the coming years. This will require more government bond issuance to fund future expenditures which will be magnified during the next recessionary spat as tax revenue falls.
- Central Banks will continue to be a buyer of bonds to maintain the current status quo, but will become more aggressive buyers during the next recession. The next QE program by the Fed to offset the next economic recession will likely be $2-4 Trillion which will push the 10-year yield towards zero.
In this past weekend’s missive “Yellen Speaks Japanese” and yesterday’s post “Debt, Deficits & Economic Warnings” I laid out the data constructs behind the points above.
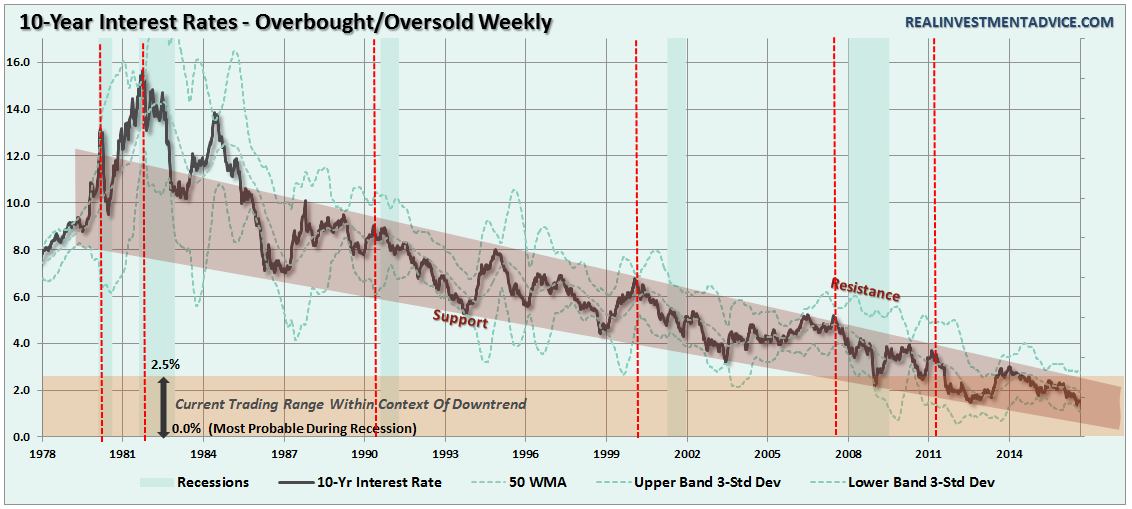
With Yellen pushing the idea of more government spending, the budget deficit already expanding and economic growth running well below expectations, the demand for bonds will continue to grow. However, from a technical perspective, the trend of interest rates already suggest a rate of zero during the next economic recession.
Outside of other events such as the S&L Crisis, Asian Contagion, Long-Term Capital Management, etc., which all drove money out of stocks and into bonds pushing rates lower, recessionary environments are especially prone at suppressing rates further. Given the current low level of interest rates, the next recessionary bout in the economy will very likely see rates near zero.
Furthermore, given rates are already negative in many parts of the world, which will likely be even more negative during a global recessionary environment, zero yields will still remain more attractive to foreign investors. This will be from both a potential capital appreciation perspective (expectations of negative rates in the U.S.) and the perceived safety and liquidity of the U.S. Treasury market.
Lastly, my recent points on current levels of volatility, and the expectation of a reversal, also support the idea of lower interest rates. As I stated:
In my opinion, there seems to be a higher than normal probability that volatility will take a turn higher sooner rather than later. As such as I have added a net long position in portfolio betting on a rise to hedge against the coincident decline in my net long equity holdings at the current time.
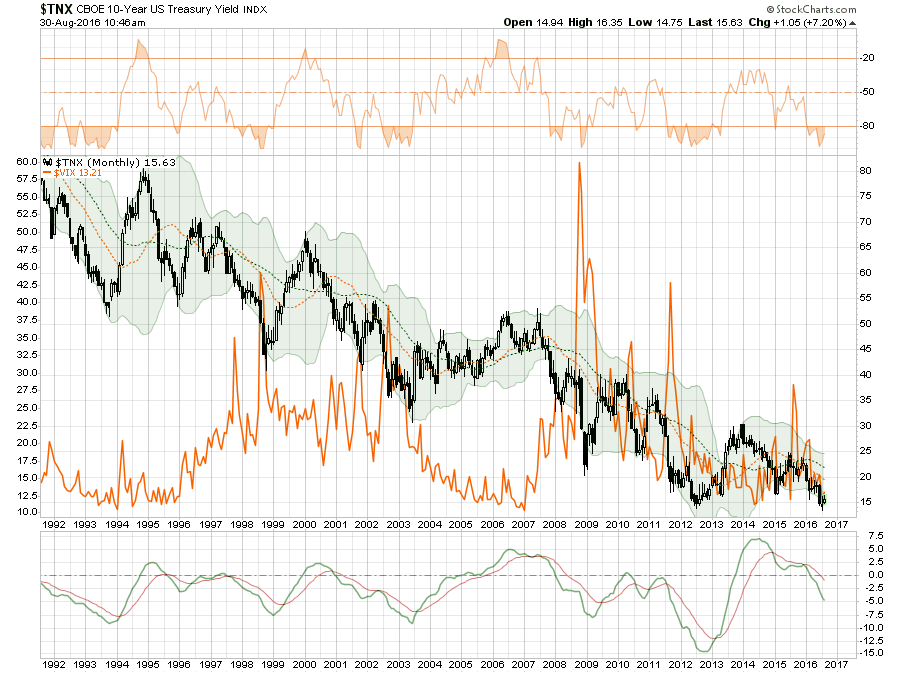
Not surprisingly, increasing rates of volatility that coincide with declines in asset prices have also coincided with declines in interest rates. As shown in the chart below, while interest rates are currently at oversold levels on a monthly basis, and could bounce towards 2%ish, the next “risk-off” phase that coincides with a rise in volatility will push rates towards the zero bound.
Here is the point, while the punditry continues to push a narrative that “stocks are the only game in town,” this will likely turn out to be poor advice. But such is the nature of a media driven analysis with a lack of historical experience or perspective.
From many perspectives, the real risk of the heavy equity exposure in portfolios is outweighed by the potential for further reward. The realization of “risk,” when it occurs, will lead to a rapid unwinding of the markets pushing volatility higher and bond yields lower. This is why I continue to acquire bonds on rallies in the markets, which suppresses bond prices, to increase portfolio income and hedge against a future market dislocation.
In other words, I get paid to hedge risk, lower portfolio volatility and protect capital. Bonds aren’t dead, in fact, they are likely going to be your best investment in the not too distant future.
In the short-term, the market could surely rise. This is a point I will not argue as investors are historically prone to chase returns until the very end. But over the intermediate to longer-term time frame, the consequences are entirely negative.
As my mom used to say:
It’s all fun and games until someone gets their eye put out.

