Last week, I covered the extremely low levels of volatility in the market and the building potential for a snap back reversal which would likely coincide with a decline in the market. To wit:
The level of ‘complacency’ in the market has simply gotten to an extreme that rarely lasts long.
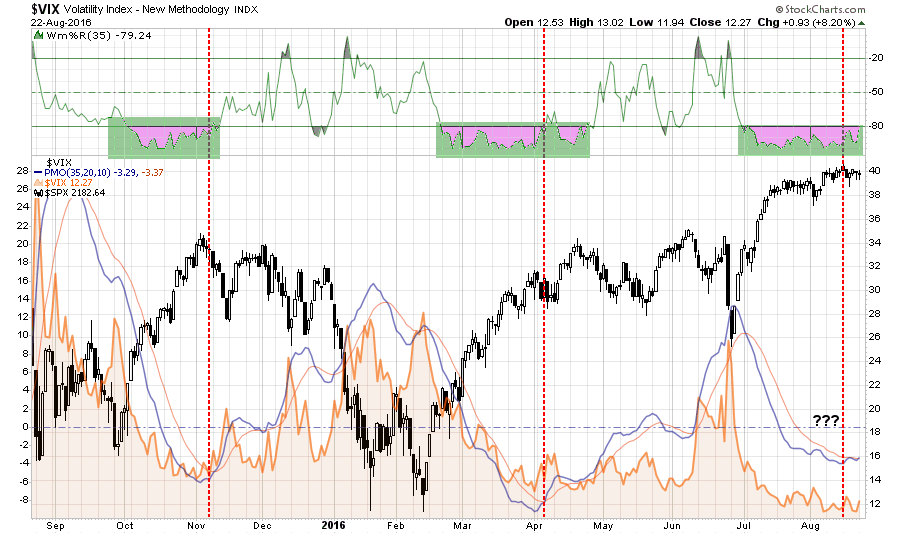
The chart below is the comparison of the S&P 500 to the Volatility Index. As you will note, when the momentum of the VIX has reached current levels, the market has generally stalled out, as we are witnessing now, followed by a more corrective action as volatility increases.
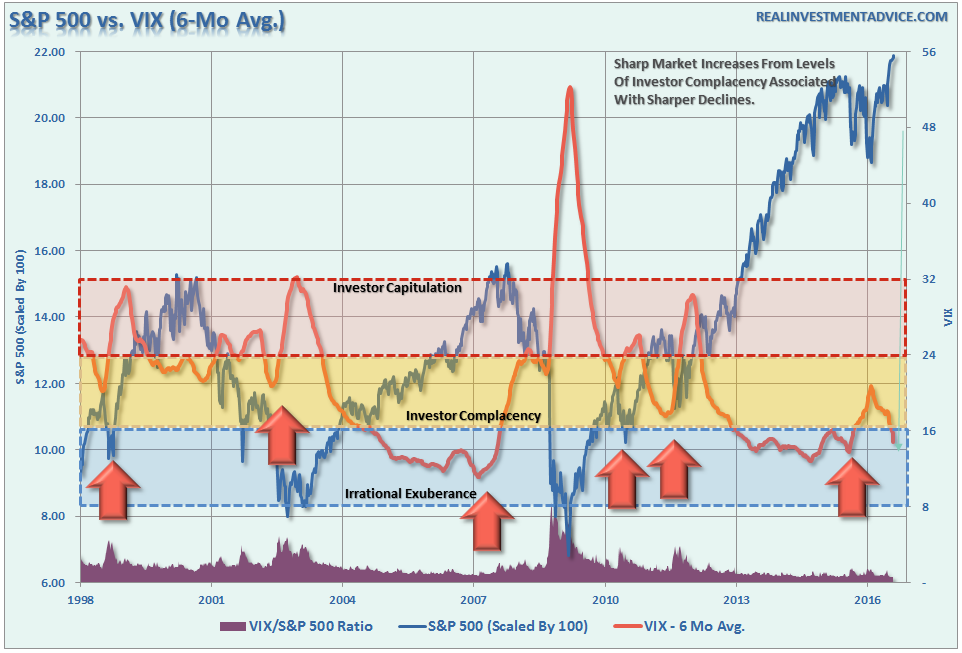
More to this point, the chart below shows the S&P 500 as compared to the level of volatility as represented by the 6-month average of the Volatility Index (VIX). I have provided three different bands showing levels of investor sentiment as it relates to volatility. Not surprisingly, as markets ping new highs, volatility is headed towards new lows.
In my opinion, there seems to be a higher than normal probability that volatility will take a turn higher sooner rather than later. As such as I have added a net long position in portfolio betting on a rise to hedge against the coincident decline in my net long equity holdings at the current time.
For my, the question really isn’t ‘IF’ it will happen, but simply ‘WHEN.'
Since then, there have been a plethora of articles written on the extremely low volatility levels with various explanations as to the causes. As James Mackintosh just penned for the WSJ:
Excuses can be made for the low level of the VIX, too. The implied volatility measured by the VIX should offer a premium to realized volatility, a reward for the risk taken by option sellers. Excessive complacency should show up in a shrinking risk premium, but at the moment, the gap between the VIX and realized volatility is roughly in the middle of its range from the past 20 years.
The same is true for the gap between implied volatility of the next few months and further ahead. Investors seem to think volatility will pick up a bit, and again the oddity is where it stands now, not what investors are doing.
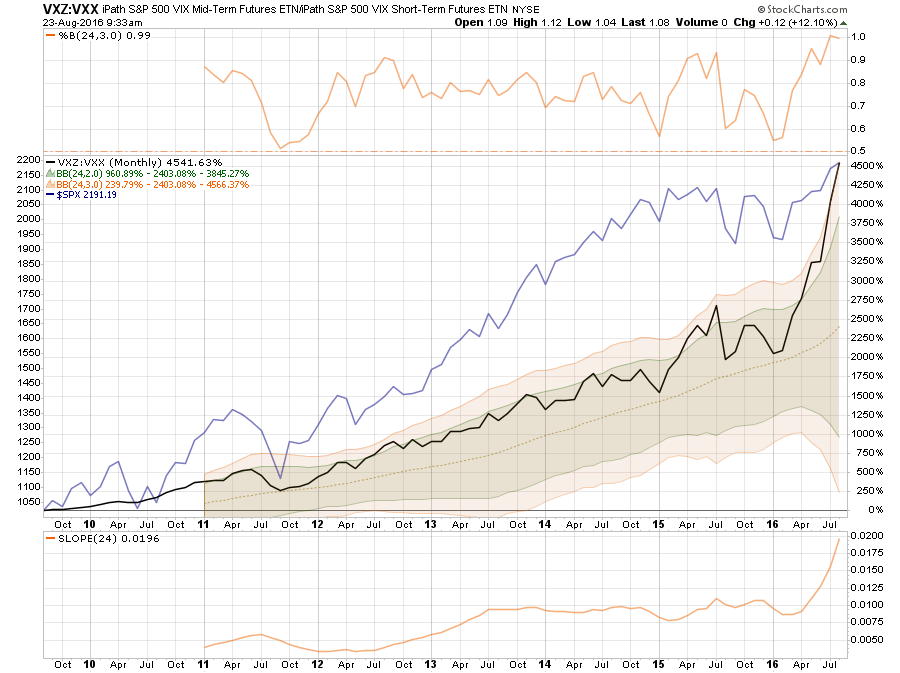
It is an interesting point. However, as the monthly chart below shows, the ratio between the Mid-Term Futures and Short-Term Futures has gone parabolic since the beginning of this year. Currently, at 3-standard deviations of the 24-month (2-year) moving average, extreme complacency would be the proper assessment.
I agree with James’ conclusion:
If the Fed offers free insurance, there is no point buying your own, which ought to keep the price of puts—that is, implied volatility—down.
Faith in how far central banks will protect against losses comes and goes, though. In market-speak, the Yellen put is less out of the money if a smaller price fall pushes the Fed to act. At the moment, investors seem to think the put is barely out of the money at all.
The danger, then, is not so much complacency about markets, but complacency about central banks. The lesson of the past seven years is that policy makers will step in every time disaster strikes. But investors tempted to rely on the central banks should note that disasters did still strike, and markets had big falls before help arrived. The time to buy insurance is when it is cheap, and for the U.S. stock market, that is now.
As I noted last week, I began buying “insurance” for portfolios specifically for this reason.
Bond Bull Market Lives
The death of the bond bull market has been greatly exaggerated in recent months. There is an assumption that because interest rates are low, that the bond bull market has come to its inevitable conclusion. The problem with this assumption is two-fold:
- All interest rates are relative. With more than $10-Trillion in debt globally sporting negative interest rates, the assumption that rates in the U.S. are about to spike higher is likely wrong. Higher yields in U.S. debt attracts flows of capital from countries with negative yields which push rates lower in the U.S. Given the current push by Central Banks globally to suppress interest rates to keep nascent economic growth going, an eventual zero-yield on U.S. debt is not unrealistic.
- The coming budget deficit balloon. Given the lack of fiscal policy controls in Washington, and promises of continued largesse in the future, the budget deficit is set to swell back to $1 Trillion or more in the coming years. This will require more government bond issuance to fund future expenditures which will be magnified during the next recessionary spat as tax revenue falls.
- Central Banks will continue to be a buyer of bonds to maintain the current status quo, but will become more aggressive buyers during the next recession. The next QE program by the Fed to offset the next economic recession will likely be $2-4 Trillion, which will push the 10-year yield towards zero.
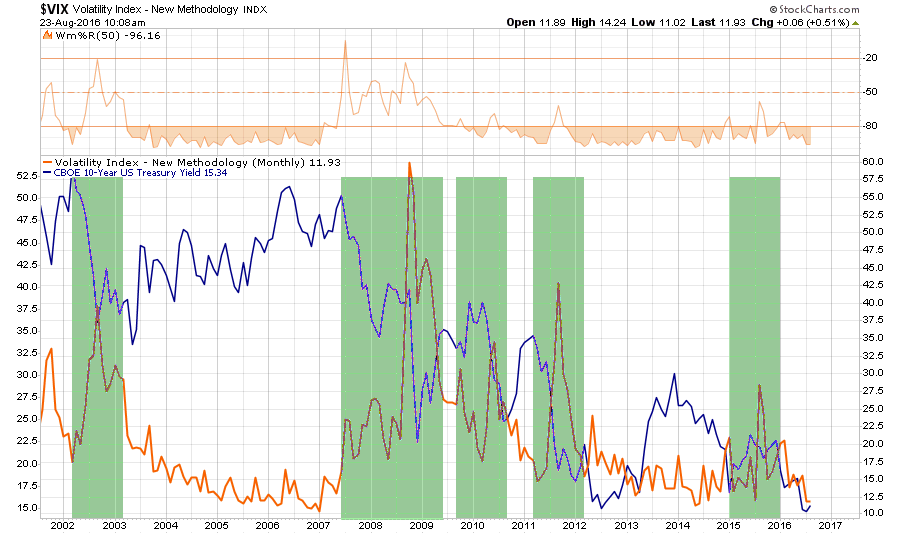
Furthermore, as shown in the chart below, there is a correlation between spikes in market volatility, brought on by declines in asset prices, and declines in interest rates. This should be of no surprise as market participants rotate from “risk” to “safety” during market routs.
While individuals continue to “chase a diminishing yield” in stocks, the likelihood of continued capital appreciation in bonds for the foreseeable future will likely continue particularly when the need for “safety” trumps the desire for “risk.”
Gary Shilling summed this up well recently:
Nevertheless, many stock bulls haven’t given up their persistent love of equities compared to Treasuries. Their new argument is that Treasury bonds may be providing superior appreciation, but stocks should be owned for dividend yield.
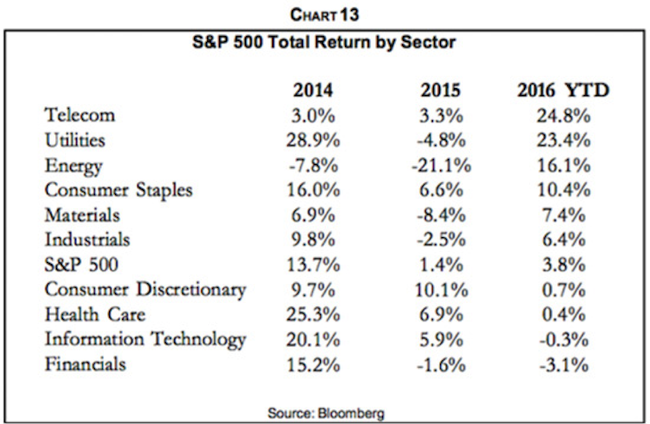
That, of course, is the exact opposite of the historical view, but in line with recent results. The 2.1% dividend yield on the S&P 500 exceeds the 1.50% yield on the 10-year Treasury note and is close to the 2.21% yield on the 30-year bond. Recently, the stocks that have performed the best have included those with above average dividend yields such as telecom, utilities, and consumer staples (Chart 13).
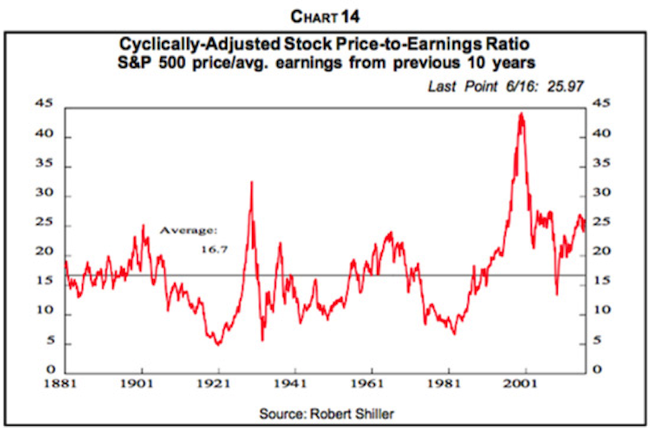
Then there is the contention by stock bulls that low interest rates make stocks cheap even through the S&P 500 price-to-earnings ratio, averaged over the last 10 years to iron out cyclical fluctuations, now is 26 compared to the long-term average of 16.7 (Chart 14). This makes stocks 36% overvalued, assuming that the long-run P/E average is still valid. And note that since the P/E has run above the long-term average for over a decade, it will fall below it for a number of future years—if the statistical mean is still relevant.”
Instead, stock bulls point to the high earnings yield and the inverse of the P/E, in relation to the 10-year Treasury note yield. They believe that low interest rates make stocks cheap. Maybe so, and we’re not at all sure what low and negative nominal interest rates are telling us.
We’ll know for sure in a year or two. It may turn out to be the result of aggressive central banks and investors hungry for yield with few alternatives. Or low rates may foretell global economic weakness, chronic deflation and even more aggressive central bank largess in response. We’re guessing the latter is the more likely explanation.
Whether or not you agree there is a high degree of complacency in the financial markets is largely irrelevant. The realization of “risk,” when it occurs, will lead to a rapid unwinding of the markets pushing volatility higher and bond yields lower. This is why I continue to acquire bonds on rallies in the markets, which suppresses bond prices, to increase portfolio income and hedge against a future market dislocation.
In other words, I get paid to hedge risk, lower portfolio volatility and protect capital.
Bonds aren’t dead, in fact, they are likely going to be your best investment in the not too distant future.
I don’t know what the seven wonders of the world are, but the eighth is compound interest. – Baron Rothschild

