As indices but not the entire market, keep crawling higher on the unprecedented market expansion in select stocks, imbalances are building that suggest reversion risk is increasing.
Market Cap Expansion From March Lows Is Unprecedented
Whether this reversion risk sets up for a buyable dip or a change in market character remains to be seen, but the more disconnected charts get, the larger the reversion risk in my view. Call me old fashioned but I still subscribe to an apparently forgotten scientific theory known as gravity.
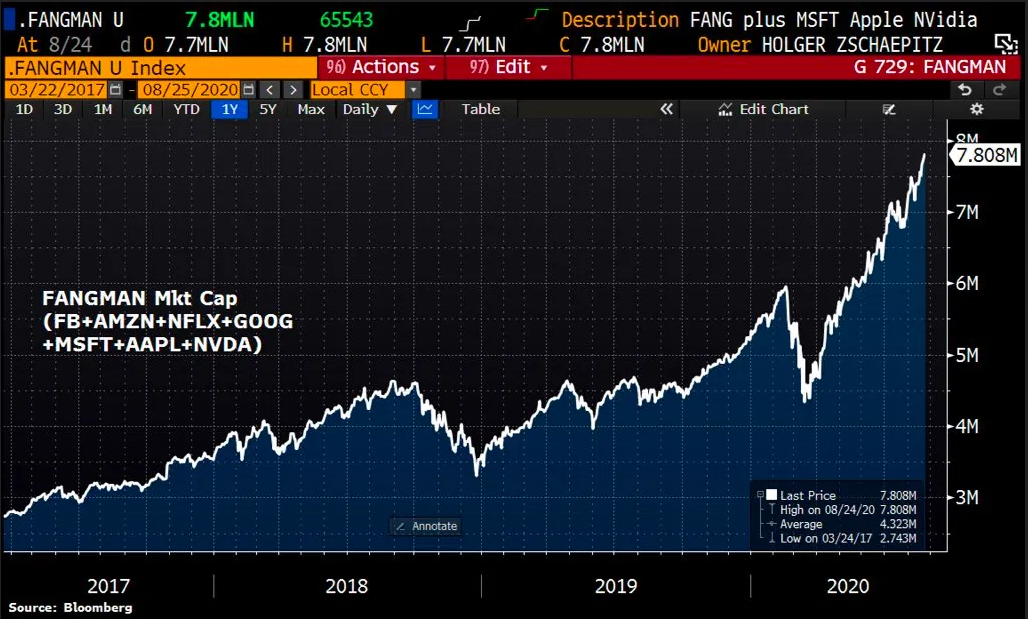
And to be clear, the market cap expansions we’re witnessing in 2020 off the March lows are without precedence:

Just 7 Stocks Driving Indices Higher
Nearly $8 trillion market cap concentrated in just a few stocks. If you want to think these 7 stocks have added $4 trillion worth of future earnings potential since 2018 be my guest, but not this analyst here. No Sir.
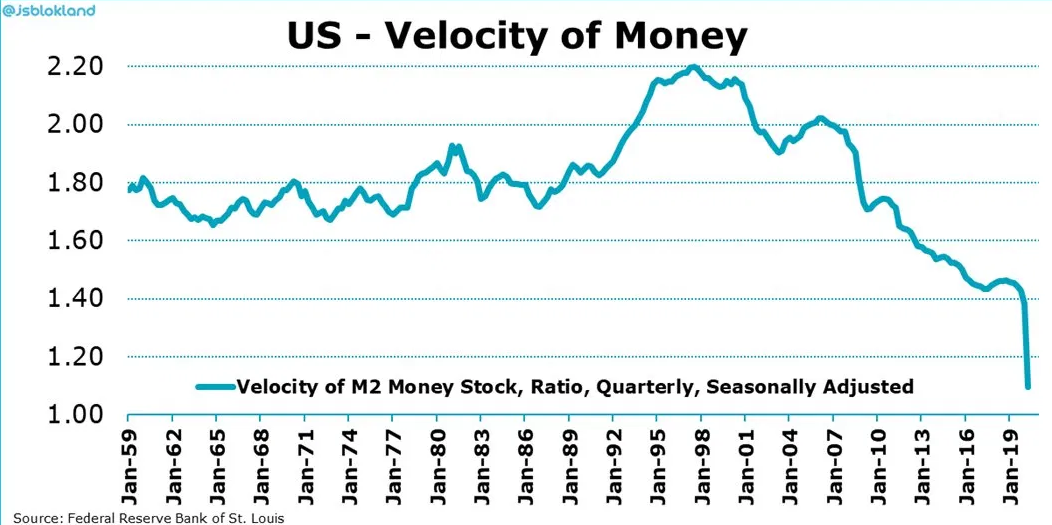
And amid this explosive market cap expansion we are also witnessing a total collapse in the velocity of money:

Asset Price Inflation Driven by Fed Liquidity Injections
This means all this liquidity is not making it into the real economy. The Fed, with its insane liquidity injections, has brought about massive asset price inflation, but it’s not lead to banks lending. The temporary goosing of reserves has led to a bloating of balance sheets that have contributed to the depression of the dollar:

But without lending this will invariably prove to be a short term sugar high and a reversal in the dollar would lead to an aggressive repricing of asset prices.
And be clear: This 5 month long rally has largely remained uncorrected and what were extremes at the lows (1929 Redux) has now led to extremes at these new index highs.
Case In Point

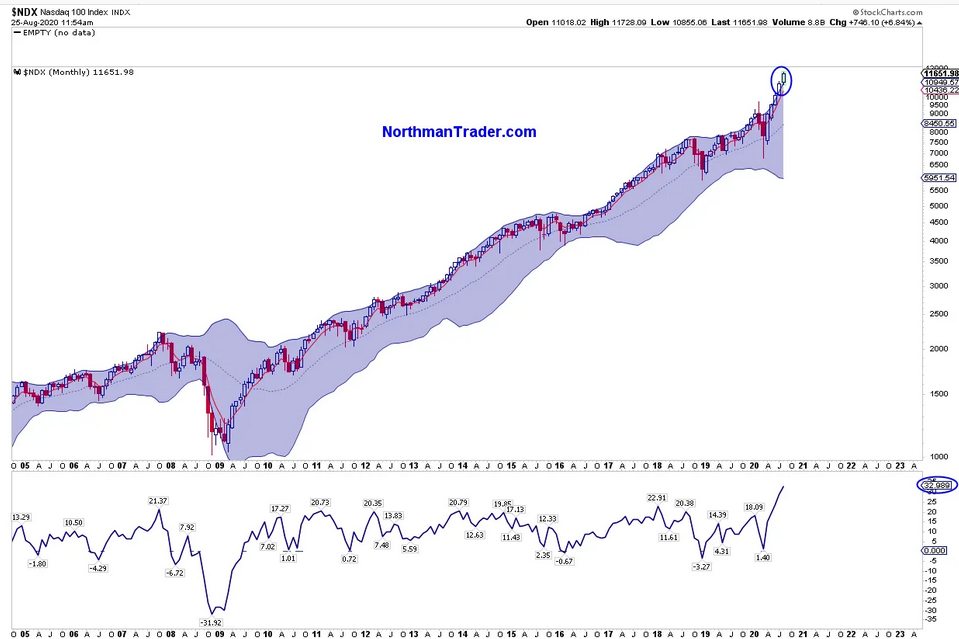
The monthly chart now pushed far outside the monthly Bollinger band. It did so at the top in 2007, 2011, 2012, 2018, 2020. In 2014 we saw several months in a row poking above, but always reverting at some point inside the monthly Bollinger band. Here the August price is entirely outside the Bollinger band increasing reversion risk.
Furthermore note the price oscillator versus the monthly 20MA is now over 32%, by far the most extreme extension in 15 years.
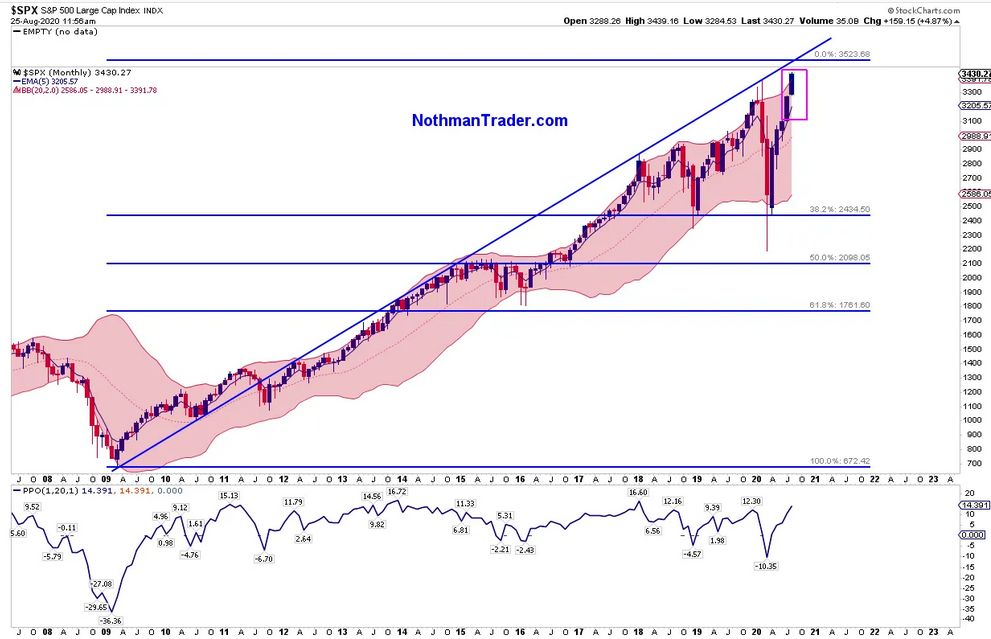
The monthly S&P 500 chart shows a similar stretch, yet not quite as extreme as fewer components are tech driven versus Nasdaq of course:

Still, the S&P 500 is over 225 handles above its monthly 5 EMA, a moving average that is very frequently tagged, and price is also outside the monthly Bollinger band. The oscillator is also stretched at 14.39, but has seen slightly more extremes in recent years, all of which have led to reversion.
Furthermore it should be noted that a major trend line is approaching just ahead offering formidable resistance should price get there.
Bottom Line
All of history suggests reversion risk is building as imbalances are building.
