🐂 Not all bull runs are created equal. November’s AI picks include 5 stocks up +20% eachUnlock Stocks

U.S. Indices: Do They Look Healthy To You?

Published 01/06/2016, 12:11 AM
Updated 07/09/2023, 06:31 AM
NDX
-
US500
-
DJI
-
SPY
-
WIL5
-

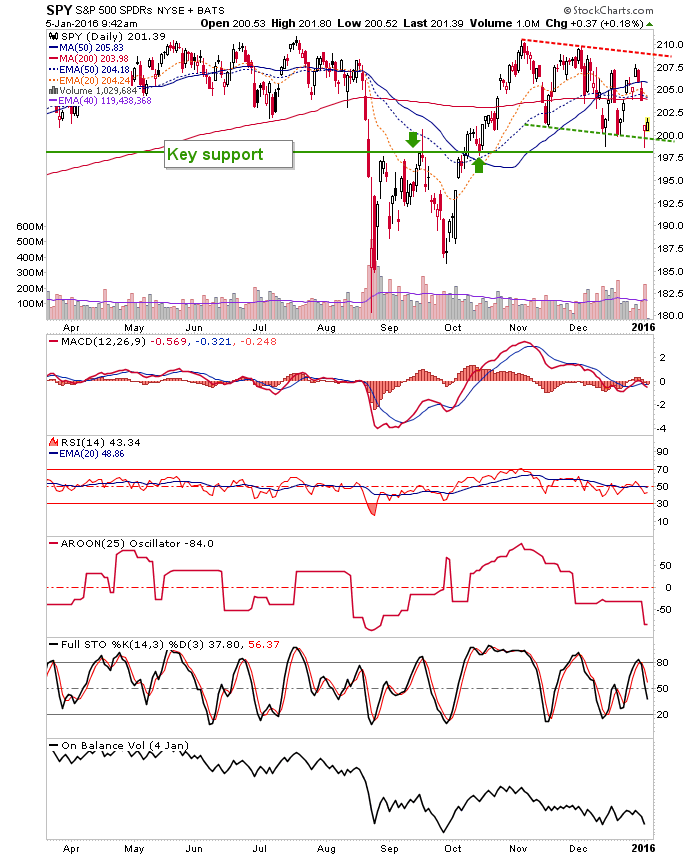
We have been following gentle downtrend channels like this one in the SPDR S&P 500 (N:SPY) on the SPX and Dow for weeks now, along with a sideways channel on NDX. Subscribers were well prepared for Monday’s drop to the channel bottoms and what I think could be a bounce attempt per support noted on this chart, below.

MACD and RSI are weak, the trend is down, STO has probably not bottomed after crossing below 80 and OBV is very weak. I think we bounce, but those with bearish conviction will be looking at the moving average cluster (which would fill the gap) or as an extreme, the channel top as limiters.

SPY Daily

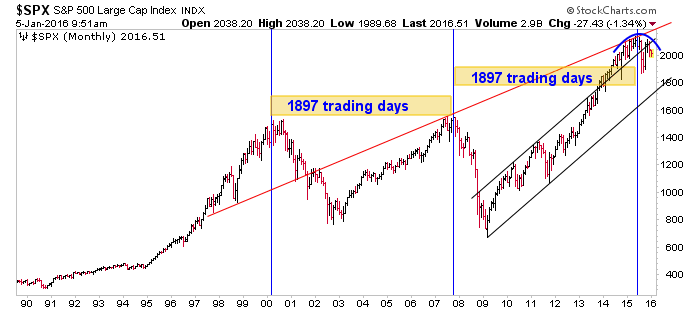
We have been noting the “dunce” cap on SPX head (blue) for months now. Also, this chart is my representation of cycle analysis that I bought from Peter Eliades that seems to have nailed a top of some kind. We reviewed this months ago as well.

SPX Monthly with 'Dunce Cap' 1990-2016

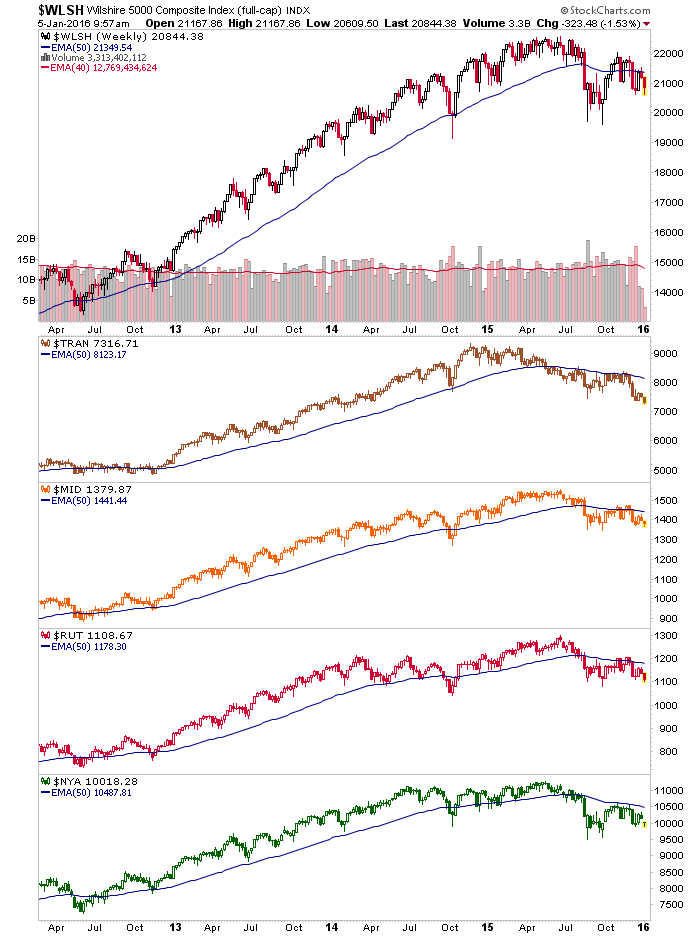
Finally, here is a broader view of the US market using the Wilshire 5000 weekly chart. We have kept this front and center as well. Does this look healthy to you?

WLSH Weekly with TRAN, MID, RUT, NYA 2012-2016

I expect a bounce, but the intermediate trend is heading to bearish now. A loss of support per the SPY at top would pretty much seal that deal.

Latest comments

Loading next article…
Risk Disclosure: Trading in financial instruments and/or cryptocurrencies involves high risks including the risk of losing some, or all, of your investment amount, and may not be suitable for all investors. Prices of cryptocurrencies are extremely volatile and may be affected by external factors such as financial, regulatory or political events. Trading on margin increases the financial risks.
Before deciding to trade in financial instrument or cryptocurrencies you should be fully informed of the risks and costs associated with trading the financial markets, carefully consider your investment objectives, level of experience, and risk appetite, and seek professional advice where needed.
Fusion Media would like to remind you that the data contained in this website is not necessarily real-time nor accurate. The data and prices on the website are not necessarily provided by any market or exchange, but may be provided by market makers, and so prices may not be accurate and may differ from the actual price at any given market, meaning prices are indicative and not appropriate for trading purposes. Fusion Media and any provider of the data contained in this website will not accept liability for any loss or damage as a result of your trading, or your reliance on the information contained within this website.
It is prohibited to use, store, reproduce, display, modify, transmit or distribute the data contained in this website without the explicit prior written permission of Fusion Media and/or the data provider. All intellectual property rights are reserved by the providers and/or the exchange providing the data contained in this website.
Fusion Media may be compensated by the advertisers that appear on the website, based on your interaction with the advertisements or advertisers.
© 2007-2024 - Fusion Media Limited. All Rights Reserved.