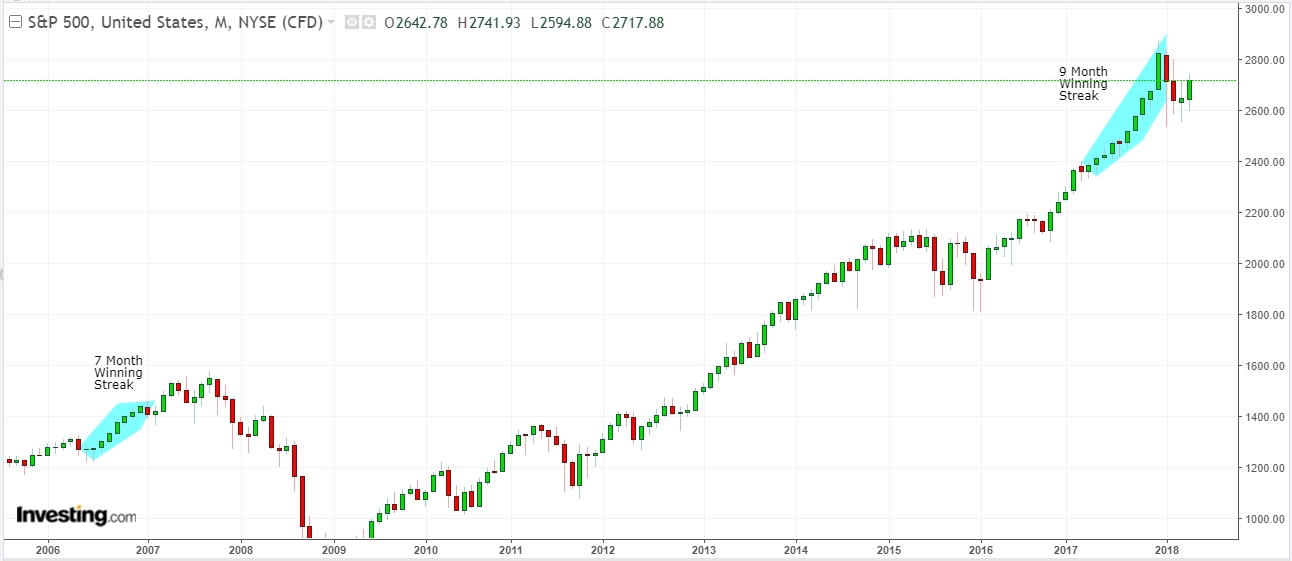
Since last year, I was more than clear that the US Stock market has been in a bubble. The S&P 500 had an incredible rally of 9 straight months, not achieved since 2006 right before the sub-prime mortgage crisis. You don´t have to be a professional bank investor to realize that the rally is just not healthy for stocks, and when the time comes, it’s going to hurt.
Now, we know that something isn’t right, and the market had its first reaction on early 2018. The next thing to know is when it will happen and how deep can it fall. The first question is the hardest one, as no one actually knows when stocks can start a free fall, however one can estimate what will happen before that.
What needs to happen?
First signs of a recession are the lack of new highs in the stock market. At this stage, it will be highlighted as a correction, investors aren’t willing to raise their open positions no matter how good the quarterly report is, it’s just not safe to keep pouring money in the market. This stage is already cleared as the S&P 500 hasn’t posted new highs since January.
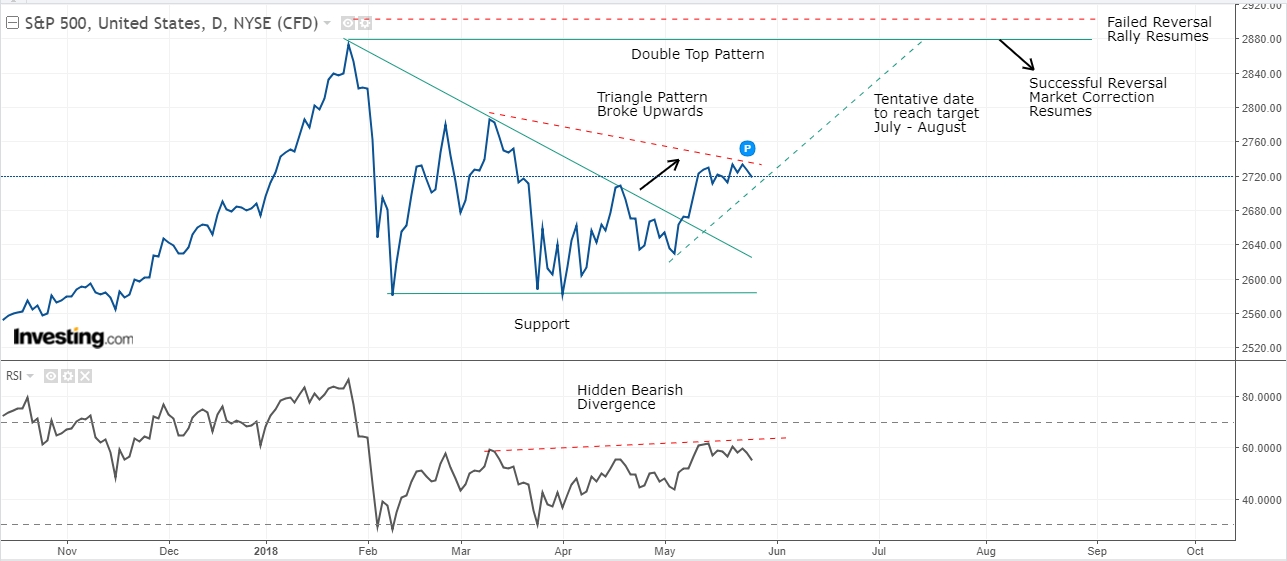
Technical reversal patterns start to appear like double top, triangles, head and shoulders (SHS) and others. A reversal pattern gives a good approach when a freefall could start, failure to reverse will just mark a market correction and resume rally. We're currently at this stage.
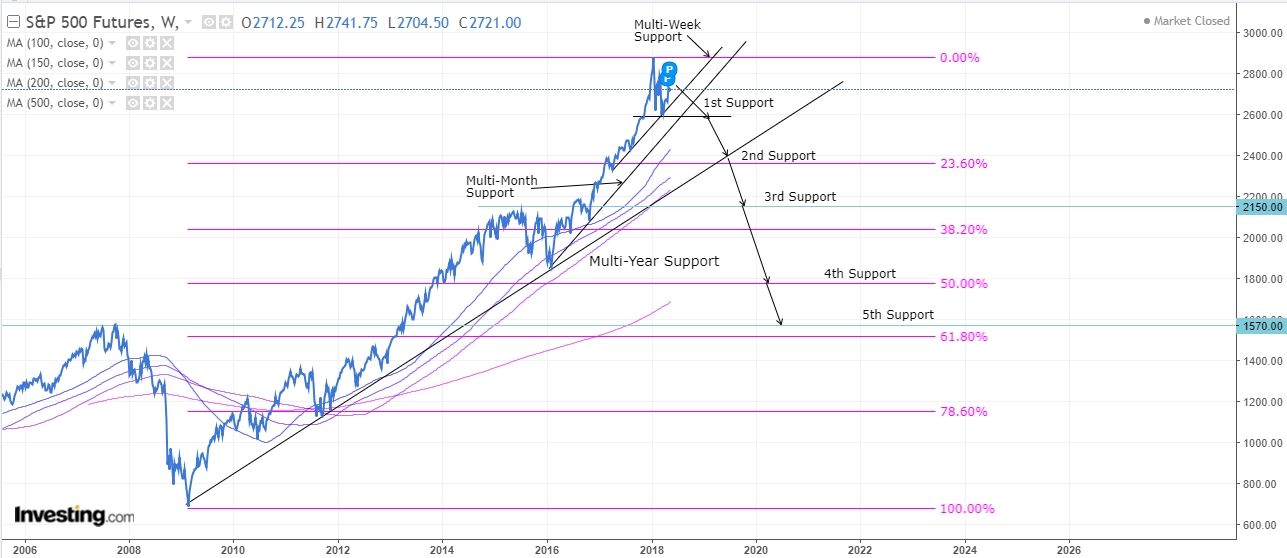
According to the picture below, since the first reversal pattern was already broken and failed to reverse, a second pattern is showed as a double top (most likely to occur), if the market maintains its current trend, we could see this pattern developing on July to August. If it occurs, we will have to pay attention to what will happen, price would need to reach at least $2.905 to start considering a new rally, there would still be some room for a SHS pattern but it would be unlikely to happen. Failing to break would resume a market correction likely to test $2.600 again, if it breaks that support, a Fibbonacci retracement would be applied.
Having cleared the first stage and with the second stage in process, it’s convenient to be prepared for the worst scenarios. If the market fails to reverse then no harm is made, on the contrary, brace for impact as third scenario is ready to come into effect.
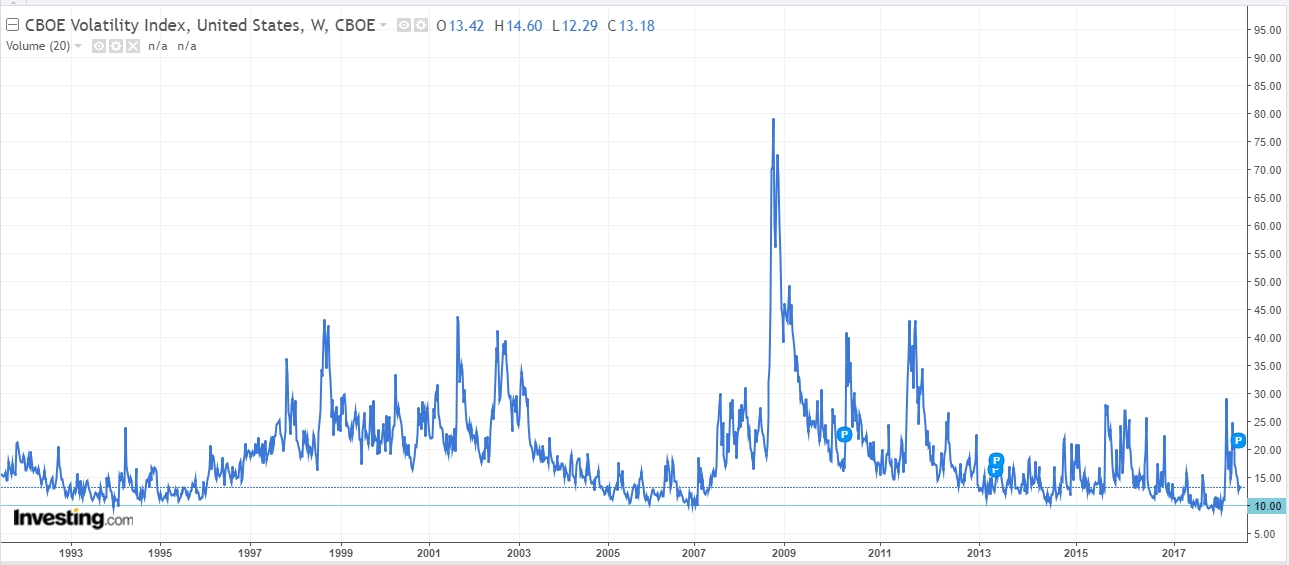
First, let’s look at the VIX, it’s an Index most investors use when markets start to enter a correction phase. We can see that 10.00 is a multi-year support and normally when it reaches that price things don’t get better. In 1993 and 1995 it reached that level and started to raise until 2003 (Dot-Com Crisis). In 2006 and 2007 it was reached again and rallied until 2009 (Sub-Prime Crisis). Again on 2017 it touched 10.00 before reaching almost 30.00 on 2018.
Just looking at the VIX one can deduce there is plenty of room for another rally, which means that another crisis is likely to happen and the worst part is that we’re not too far from it.
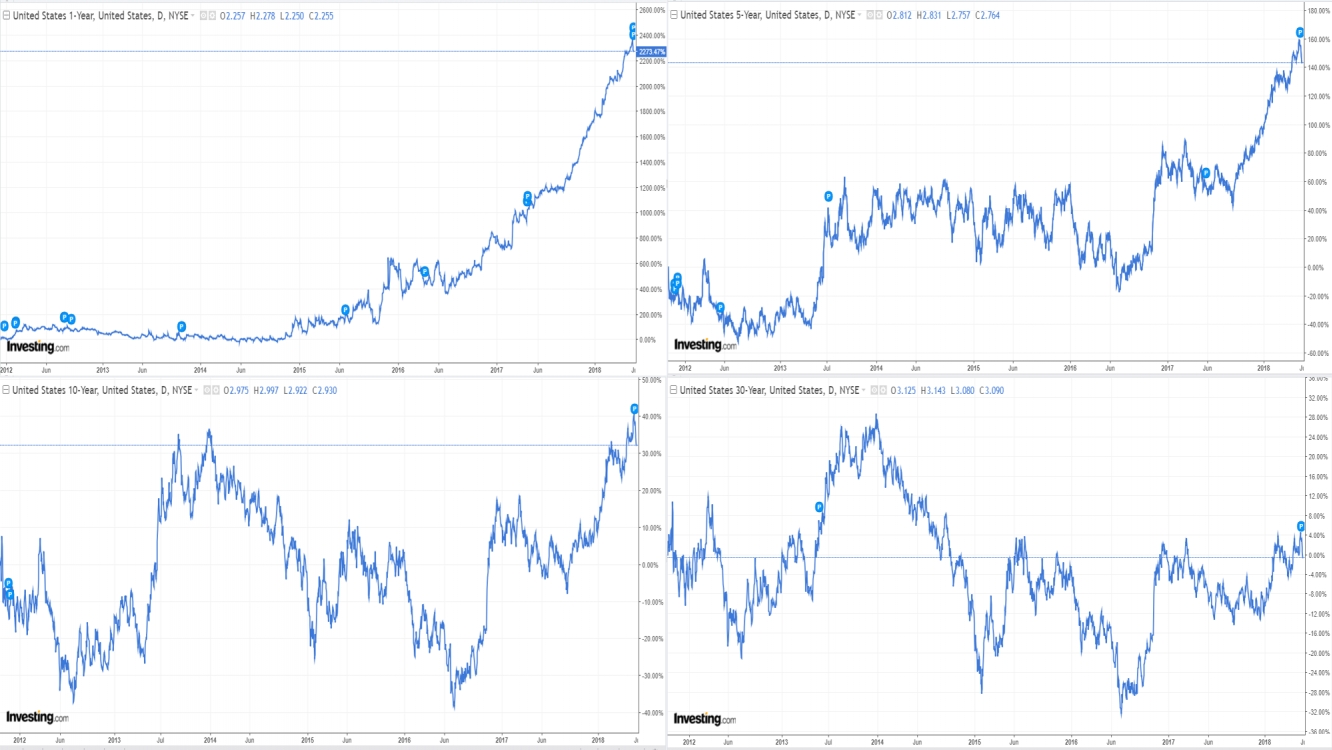
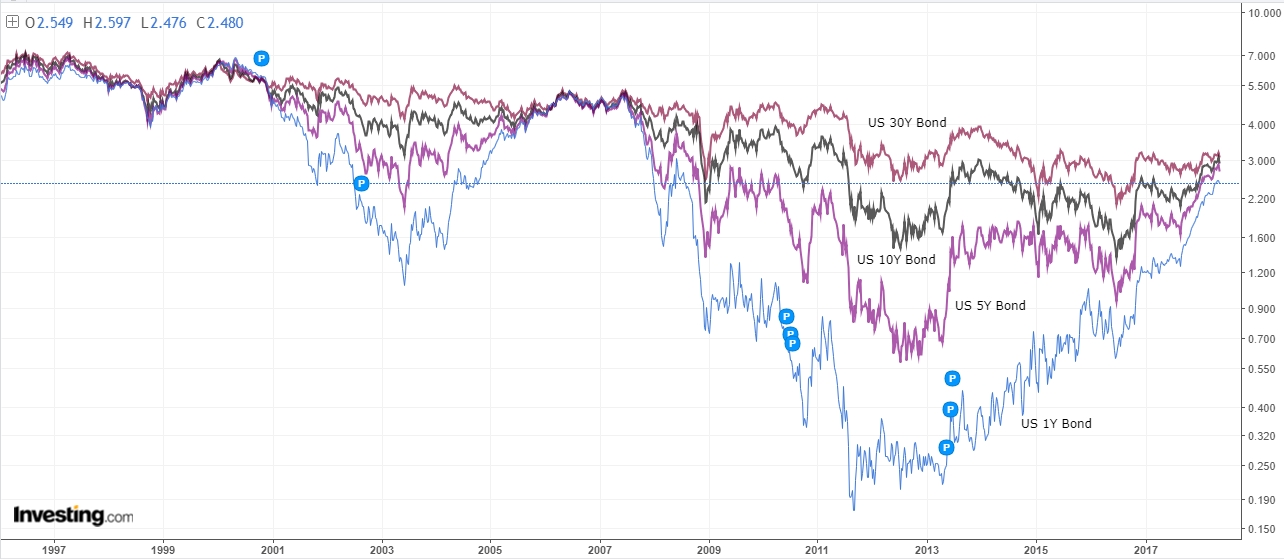
Let’s look at the Treasury market as it normally predicts when a crisis is near. It is also known as securities since investors can deposit their money knowing that it's safe and will receive a small but secure rate in return. The question is: How long are you considering your investment safe? Higher return rates require longer contracts. When investors buy 10Y or 30Y bonds (raising yield rate), smaller ones like 1Y or 5Y raise slower than the other two as investors are willing to leave their money longer time on the actual rate. When short term contracts yield is near long term yield, investors prefer securing their money under a short term than longer. When short term yield is far lower than a long yield, things are ok. But when short yields near long ones, you should start worrying as investors aren’t comfortable with the current economy. If short yield crosses above long yield, a recession has started.
Looking at the charts bellow, one can see how brutally short term yields have risen compared to their rates in 2012. 1Y peaked +2400% while 5Y +160%. A 2000% growth in only 6 years is not stable, if we add the fact that 10Y has only risen +40% and 30Y nearly +4%, one can see the magnitude of the problem. It won’t be long for the 1Y yield to approach or even cross the 30Y.
Under these circumstances, one can conclude that a market crash is more probable than a market correction. Analyzing the S&P 500, VIX and Treasuries all point to a further downtrend. Now that we have answered when it will happen, let’s move to the other question: How deep can it fall?
As I stated before, one of the best tools to determine a reversal is the Fibbonacci Retracement, also added are multi-year, month and week trend lines. The first support is located at 2600 where it has been consolidating since January. Second support located at Multi-year support which nearly matches Fib 23.6% (healthy support) the third support would be located at 2016 resistance (major setback), fourth support located at Fib 50% (meltdown) and last support located at 2007 resistance (falling knife).
When will this happen? How deep will it fall? Nobody knows, the only one can do is forecast based on statistics. The truth is that we are near something big and we should be prepared for it.
Which stock should you buy in your very next trade?
AI computing powers are changing the stock market. Investing.com's ProPicks AI includes 6 winning stock portfolios chosen by our advanced AI. In 2024 alone, ProPicks AI identified 2 stocks that surged over 150%, 4 additional stocks that leaped over 30%, and 3 more that climbed over 25%. Which stock will be the next to soar?
Unlock ProPicks AI
