Last week we looked at the largest percentage losses in the Dow since 1965. We learned that the months August through November saw the highest concentration of single-day losses of 3% or higher.
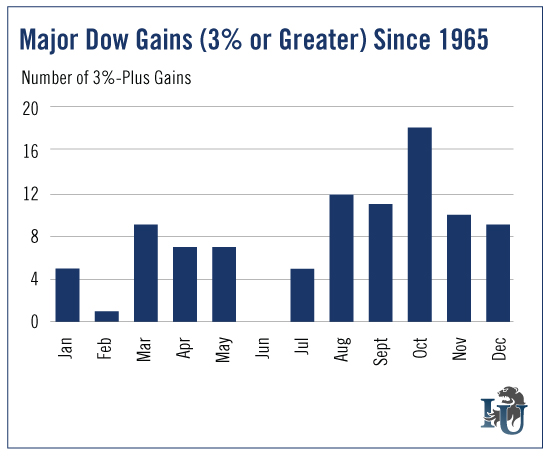
In today’s chart, we’re going to look at the market’s largest gains. And, just like before, we wanted to know the months when they were most common.
The first thing you’ll notice is the chart above looks strikingly similar to last week’s. Once again, we see that the months with the most activity are August through November. October has the most gains but also has the most losses.
Of the 20 largest gains over the past 50 years, eight occurred in October. In contrast, June tends to be a stable month for the market. It’s seen very few large losses and virtually no large gains.
So what’s to be done during these rockier months? As Chief Investment Strategist Alex Green recently pointed out, “That depends on whether you consider yourself a trader or an investor.”
Fall months are most prone to bigger price swings compared to the remainder of the year. For the long-term investor, this is the time to find mispriced companies trading below their fair value. But if you’re a speculative trader, price fluctuations are your bread and butter. The potential to make large gains in a very short time is even greater now, but not without additional risk.
That’s why we recommend using protective stops to minimize your losses. Risk management is essential to smart investing and trading.
