Answer Depends On Your Timeframe
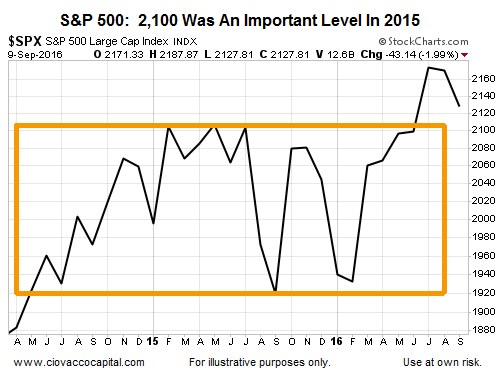
From a short-term perspective, there are concerns. On Friday, the S&P 500 closed below last year’s high of 2,134. The sell-off occurred on strong volume, and the break from the period of low volatility went in the bear’s favor. The chart below shows the recent monthly breakout.

Three Fed Speakers Monday
The most pressing short-term concern comes from a familiar source; the Fed. The markets have been boosted by numerous and unconventional “liquidity” programs from central banks around the globe. Therefore, any talk or action related to raising interest rates needs to be monitored closely, especially in the short run given the Fed has three speakers lined up for Monday, September 12, 2016.

How Did The Big Drop Impact The Longer-Term Outlook?
Common sense tells us a one day sell-off typically would have little impact on longer-term trends. However, Friday’s sell-off was broad and sharp.
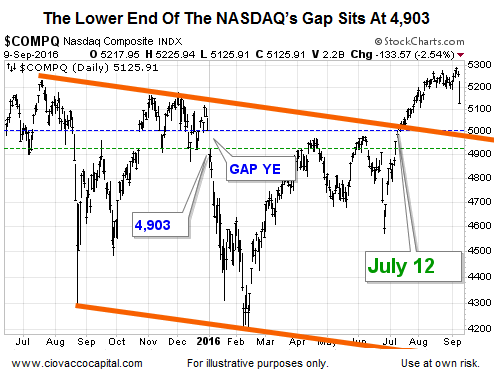
To make sure we are comparing longer-term apples to longer-term apples, this week’s video covers updated charts from longer-term outlooks outlined on August 20 and September 2. The video also reviews historical cases when volatility followed a bullish breakout from a long-term consolidation box, similar to what recently occurred in all three major U.S. stock indexes. Reviewing facts regarding longer-term bullish probabilities relative to longer-term bearish probabilities allows us to put some longer-term context around Friday’s ugly sell-off.
A Fed-Related Incident Remains A Possibility
Anyone who has been involved in the markets over the past twenty years will tell you central banks have always been a big part of the bull/bear equation and a source of potential volatility. Experienced market participants will also tell you the difference today is the frequency and magnitude of market intervention from central bankers.
Given the market’s heavy reliance on low rates, QE, and unconventional policies, we will enter next week with an open mind about all outcomes, including longer-term bearish outcomes. However, we will continue to make decisions based on facts, rather than forecasts or concerns about what may or may not happen.
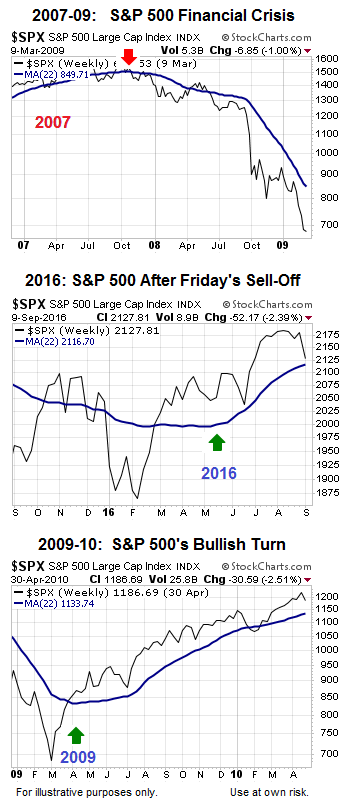
If the Fed is going to kill the bull market with rate hikes and a new and devastating bear market started last Friday, it is highly unlikely the S&P 500’s chart will maintain its current longer-term risk-reward profile, as shown via the three charts below. The slope of the S&P 500’s 22-week moving average is one way to monitor longer-term bullish conviction relative to longer-term bearish conviction. Compare and contrast the present day profile to the profile at the October 2007 peak and March 2009 bottom.

The slope of the 22-week moving average tells us very little about the prospects for additional short-term downside in stocks, something that is quite possible based on what the Fed has to say in the coming days and weeks. If short-term risks morph into longer-term risks, it will begin to show up on the charts. The video above shows how the charts look after Friday’s broad sell-off.
If the evidence starts to deteriorate in a manner that points to an unfavorable longer-term risk-reward profile, our market model will call for defensive allocation adjustments. We respect the market’s dependence on central banks, allowing us to remain flexible in the event the market’s longer-term profile flips to a bearish bias. While there is no question short-term risks have increased, it is just too early to declare a meaningful change to the market’s longer-term risk-reward profile. Time will tell.
