Big Moves Often Follow
Regular viewers of CCM’s weekly videos may be familiar with the expression “the longer a market goes sideways, the bigger the move you tend to get after a breakout or breakdown,” which aligns with the concept of periods of low volatility often being followed by big moves in asset prices.
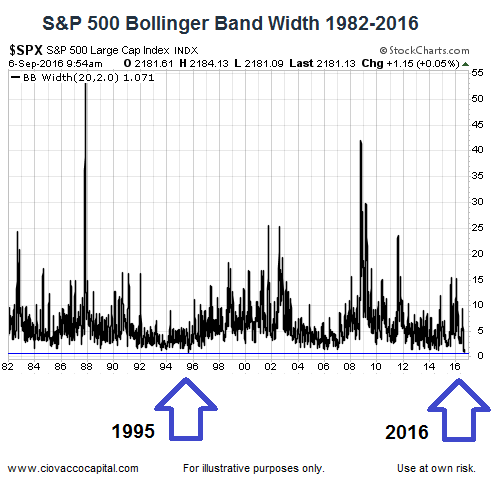
Lowest Level Dating Back To 1982
Bollinger® band width is one way to track relative volatility. When Bollinger band width readings hit extremely low levels, it tells us to be open to a big move. The S&P 500’s daily Bollinger Band width has never been lower than it is today, using data back to 1982, which means a big move could be coming soon in stocks.

The concepts behind Bollinger band width as described by StockCharts.com:
Bollinger BandWidth is best known for identifying The Squeeze. This occurs when volatility falls to a very low level, as evidenced by the narrowing bands. The upper and lower bands are based on the standard deviation, which is a measure of volatility. The bands narrow as price flattens or moves within a relatively narrow range. The theory is that periods of low volatility are followed by periods of high volatility. Relatively narrow BandWidth (a.k.a. the Squeeze) can foreshadow a significant advance or decline. After a Squeeze, a price surge and subsequent band break signal the start of a new move. A new advance starts with a Squeeze and subsequent break above the upper band. A new decline starts with a Squeeze and subsequent break below the lower band.
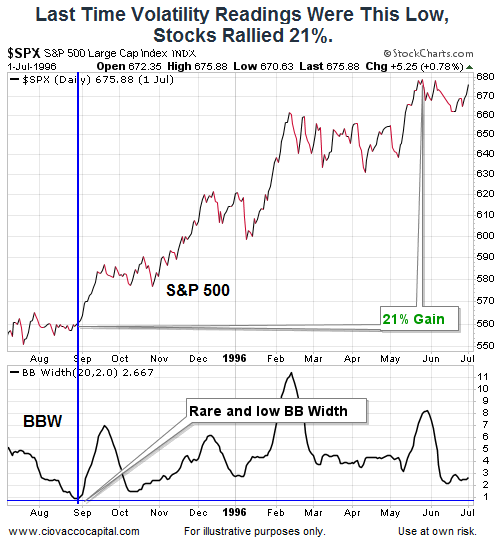
Similar Band Width In 1995
The last time Bollinger band width was as low as it is today was 1995. When volatility returned, the S&P 500 climbed 21%.

What To Look For In 2016
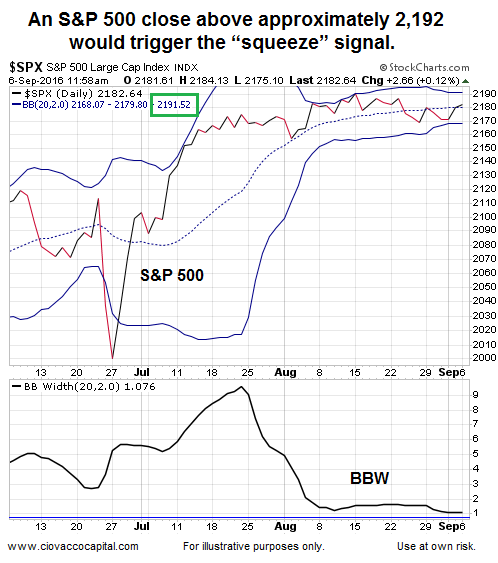
Since there is no perfect signal in the markets, this signal or setup helps us with probabilities, not certainties. To complete the “squeeze” the S&P 500 has to close above the upper Bollinger band shown below. The band level changes over time; as of Tuesday, September 6, the level to watch is 2,192.

Other Rare Signals That Lean Toward Bullish Outcomes
A low Bollinger band width in isolation does not hint at which way the market may break (up or down); that comes with the “squeeze”, which has not occurred yet in 2016. However, the video below covers other bullish signals that have occurred in numerous markets in 2016.
