I’m about to reveal my very best strategy for pocketing 20%+ upside (and 7%+ dividends) from closed-end funds (CEFs) in the year ahead.
And in the long run, you could be in for truly monstrous gains, like the 94% return, and 8.8% dividend, I locked in using this simple plan just a few days ago.
I’m sharing this powerful tool with you now because this is the perfect time to get into CEFs. Unlike the (bubbly) S&P 500, many of these high-yield funds are cheap now—and spring-loaded for big “snap back” upside in 2020.
In fact, 380 of the roughly 500 CEFs out there—a full 75%—trade below their “true” worth as I write this.
And what I’m about to reveal is a proven way to separate the real bargains from CEFs that are cheap for a reason: with lousy management, obscene fees or, worst of all, dividends headed for the guillotine.
The One (and Only) Predictor of CEF Upside
Besides massive dividends (the typical CEF pays a gaudy 7%), CEFs stand out for another reason: they make it easy to tell if they’re oversold and ready to gap higher.
Through a number called the discount to NAV, which is just another way of saying that a CEF is trading below what the stocks, bonds, REITs or whatever investments the fund holds are worth on the open market.
These discounts are only available with CEFs, and they couldn’t be easier to spot. Any CEF screener will tell you the discount to NAV, or you can get it straight from the fund company’s website.
The strategy?
Also dead simple: look for a discount that’s wider than usual, then buy—and ride the price higher as the fund’s “discount window” slams shut. And collect your 7%+ discount while you do!
The Power of the Vanishing Discount
To show you how an evaporating discount can hand you a life-changing return, consider the Cohen and Steers Infrastructure Closed Fund (NYSE:UTF). As the name suggests, it invests in companies that own utilities, airports, toll roads and railroads.
In other words, assets known for generating a lot of cash, but not a lot of growth.
That’s why UTF yielded an outsized 8.8%, well above the CEF average, when I recommended it to subscribers of my Contrarian Income Report service in February 2016.
You’d expect a fund like this to plod along, handing us our big dividend while its underlying shares hold steady, or maybe inch up a little bit.
When you add a wide discount to NAV, the picture changes dramatically.
At the time of my buy call, UTF’s discount was an absurd 16%. As you can see below, that markdown bubbled away over the nearly four years we held the fund. (We sold UTF from our Contrarian Income Report portfolio a few days ago, on December 6.)
UTF’s Discount Narrows …
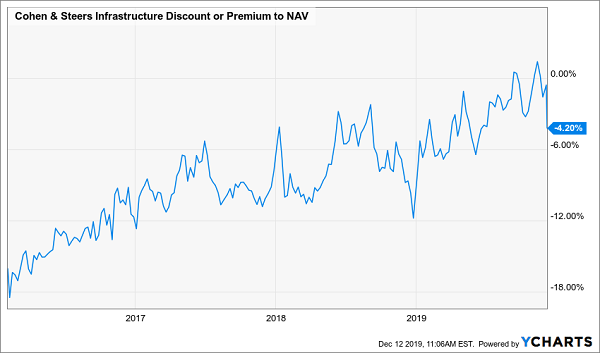
The result: by the time we clocked out, we’d bagged a 94.6% total return—from a “sleepy” income investment!
UTF Outperforms With Dividends …
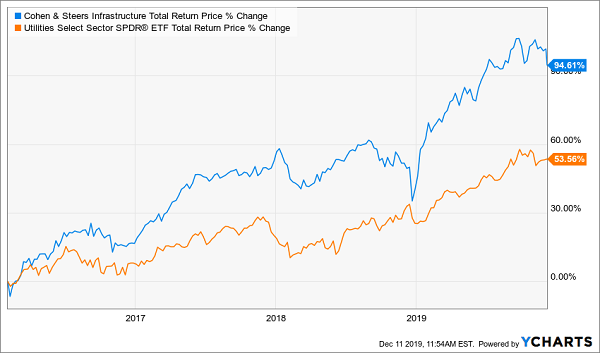
The best part? Most of this return was in cash. So unlike the owner of the typical utility stock, our Contrarian Income Report members could spend more of their return however they wanted, without having to sell a single share.
That wasn’t the end of the story.
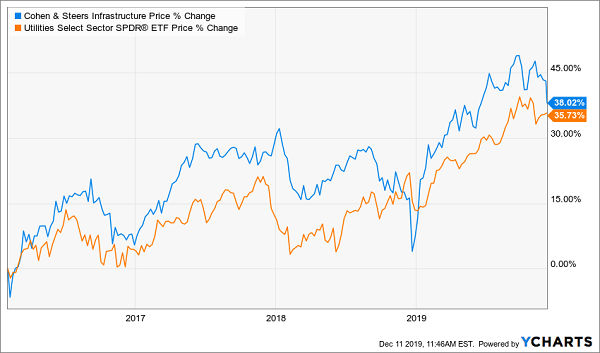
Because even when you set aside its massive payouts, the growth in UTF’s share price still topped that of the typical utility:
… and Without
This pattern recurred with another Contrarian Income Report recommendation: the Nuveen NASDAQ 100 Dynamic Overwrite Fund (QQQX), owner of America’s biggest tech stocks, with Apple (NASDAQ:AAPL), Microsoft (NASDAQ:MSFT) and Amazon.com (NASDAQ:AMZN) its top three current holdings.
The twist? Management uses a low-risk option strategy to squeeze a 6.5% payout from these goliaths, which pay paltry (or in the case of Amazon (NASDAQ:AMZN), zero) dividends.
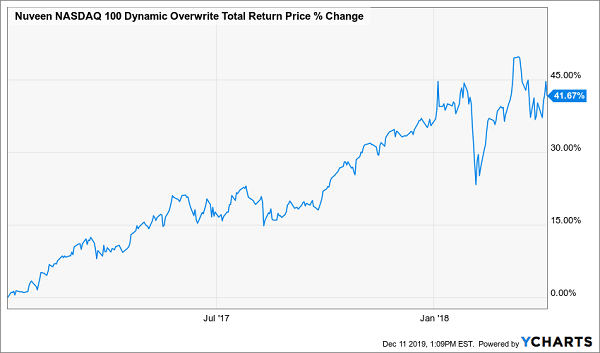
Back in January 2017, when QQQX yielded even more than it does today (a nice 7.5%), it traded at a 4.8% discount to NAV—a steal for a fund that had traded at premiums many times in the preceding seven years.
What happened next? By April 2018—just 15 months later—investors had flipped that discount to a premium. They then drove the premium to a ludicrous 13.8%.
QQQX’s Discount Turns Into a Massive Premium …
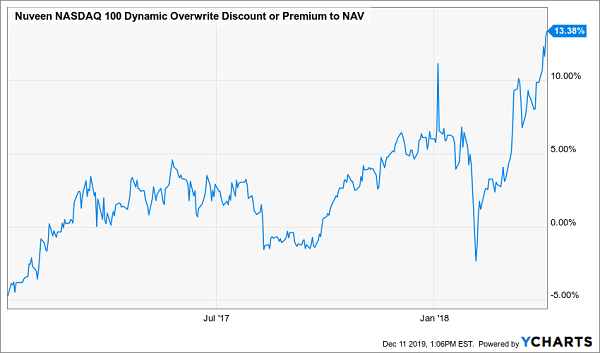
That’s right, people were happily paying $1.14 for every $1 of the Apples, Intels and Microsofts in the fund’s portfolio! That’s the definition of overbought, so we checked out, taking a quick 41.7% total return with us.
… and We Grab a Fast 41.7% Win
I know you see the pattern here, but if you’re still not sure about the power of the discount to NAV, let me show you one more example of how it delivered a huge gain to my Contrarian Income Report members.
That would be the DoubleLine Income Solutions Fund (DSL), run by the “Bond God” himself, Jeffrey Gundlach. When we bought in April 2016, DSL was living in the shadow of Gundlach’s slightly older fund, the DoubleLine Opportunistic Credit Fund (DBL).
That, plus overdone worries about rising interest rates, set us up to buy DSL at a 7% discount to NAV. The cherry on top: including the special dividends DSL had paid in the preceding year it was yielding an eye-popping 11% when we bought in.
I probably don’t have to tell you what happened next:
Discount Cycle Repeats
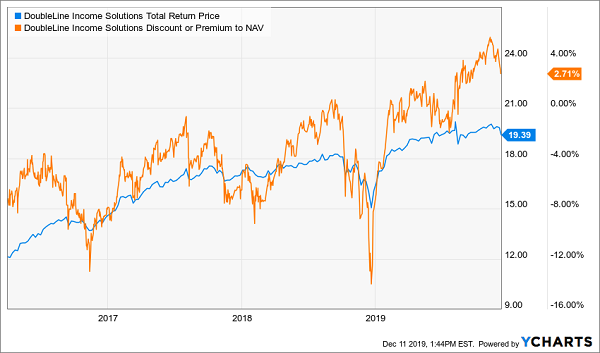
As you can see, DSL discount has flipped to a 2.7% premium, and we’ve nailed down a 60% total return, nearly doubling the gain of the corporate-bond benchmark SPDR Bloomberg Barclays (LON:BARC) High-Yield Bond ETF (JNK). Best of all, DSL’s huge dividend (current yield: 9.1%) means a full 77% of that return dropped into buyers’ accounts in safe cash.
4X Your Dividends in 2020 With the “Perfect Income Portfolio”
Finding a CEF’s discount to NAV is easy, but it’s not always easy to get accurate info on a CEF’s discount over time. And without that info, you’re just throwing darts in the dark!
That’s because, as I said earlier, many CEFs are always cheap. In those cases, the discount does nothing for you if management has no plan to close it up. So I’m going to square that circle for you now, with an invitation to get an inside look at my new “Perfect Income Portfolio.”
I’ve carefully selected the investments (including CEFs) in this high-yielding portfolio to:
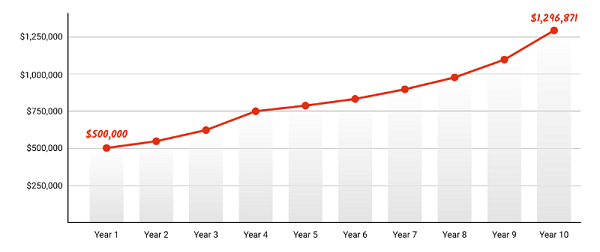
I know the name “Perfect Income Portfolio” sounds a little over the top. But what I’m about to show you is my life’s work. And the strategy behind it is proven: here’s what would have happened to your money if you’d followed it over the past 10 years:
Almost $800,000 in Gains!
Full details are waiting for you now.
Disclosure: Brett Owens and Michael Foster are contrarian income investors who look for undervalued stocks/funds across the U.S. markets. Click here to learn how to profit from their strategies in the latest report, "7 Great Dividend Growth Stocks for a Secure Retirement."
