Here is your Bonus Idea with links to the full Top Ten:
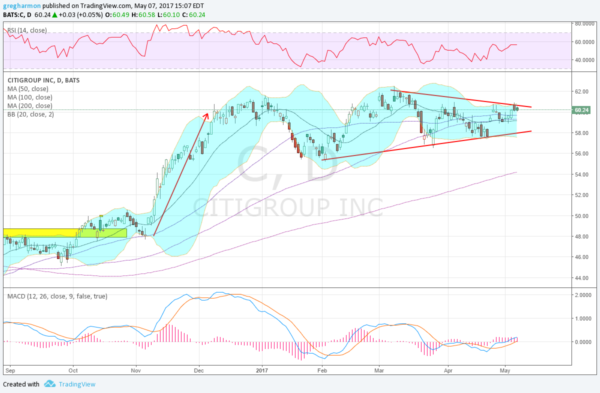
Citigroup (NYSE:C) had a great idea several years ago when they started bicycle sharing in New York City. There, I said something nice about the company. Other than that, the company’s best strategy has been that it is not Well’s Fargo the past year. The stock price is another story though. It jumped after the election in November like other bank stocks. By early December it had stopped moving up and was starting back lower. That turned to consolidation and it has been marking time sideways ever since.
The range has tightened over the last 3 months creating a symmetrical triangle. Currently it is just short of entering the power zone, about two thirds of the way through the triangle. This is where a break out tends to have the most power to run to the target. The target move on a breakout would by $6.50 when it happens. With 5 touches at the rails of the triangle it could be ready now.
The move into the triangle would give a target above that $6.50 move, should it break out higher, to 72. The RSI is sitting on the edge of the bullish zone with the MACD rising and positive. There is resistance at 60.85 and 62 then you need to go back to 2008 to find it a 67 and then 82. This is one of the few banks that has yet to retrace even 10% of the drop from the financial crisis, while many are at all-time highs. Support lower comes at 59 and 57.50 then 56.75 and 55.50. Short interest is low at 1.2%.
The options chain for this week shows strong open interest at the current $60 level, but most open interest below the price. May monthly Expiry is strong at 60 as well with big Put open interest below at 57.5 and above on the Call side at 65 with some size at 62 and 62.5 as well. June monthly options have open interest spread from 50 to 60 on the Put side and focused at 60 and 62.5 on the Call side. The July options, the first beyond the next earnings report, show open interest spread from 52.50 to 60 on the Put side and large and focused at 62.5 on the Call side.
Citigroup
Trade Idea 1: Buy the stock on a move over 61 with a stop at 59.
Trade Idea 2: Buy the stock on a move over 61 and add a June 60/57.5 Put Spread (80 cents) selling a July 65 Covered Call (65 cents) to fund it.
Trade Idea 3: Buy the June 57.5/62.5 Bullish Risk Reversal (8 cents).
Trade Idea 4: Buy the June/July 62.5 Call Calendar (80 cents) and sell the June 57.5 Put (53 cents) to fund it.
After reviewing over 1,000 charts, I have found some good setups for the week. These were selected and should be viewed in the context of the broad Market Macro picture reviewed Friday which deep into the earnings season and with the May FOMC meeting and non-farm payrolls in the books, sees equities looking strong again.
Elsewhere look for Gold to continue in its downtrend while Crude Oil also is biased lower, but with caution for a reversal. The US Dollar Index is weak and moving lower while US Treasuries are also biased to the downside. The Shanghai Composite rounds out the markets looking weak as it moves lower while Emerging Markets are biased to continue to the upside.
Volatility looks to remain at abnormally low levels keeping the bias higher for the equity index ETF’s SPDR S&P 500 (NYSE:SPY), iShares Russell 2000 (NYSE:IWM) and PowerShares QQQ Trust Series 1 (NASDAQ:QQQ). Their charts all look stronger in the short term with the SPY and QQQ leading the way. In the longer timeframe the IWM is at resistance while the SPY and QQQ look set for a series of new highs. Use this information as you prepare for the coming week and trad’em well.
DISCLAIMER: The information in this blog post represents my own opinions and does not contain a recommendation for any particular security or investment. I or my affiliates may hold positions or other interests in securities mentioned in the Blog, please see my Disclaimer page for my full disclaimer.
