-
Markets face headwinds as inflation surges, marking the fifth consecutive month of acceleration.
-
Despite rising inflation, stocks historically thrive during such a phase, and the current correction is nothing to be worried about.
-
Amid comparisons to past market bubbles, indicators suggest room for continued upside despite short-term risks.
-
Invest like the big funds for less than $9 a month with our AI-powered ProPicks stock selection tool. Learn more here>>
This week kicks off with several issues weighing on investor sentiment:
- The inflation report came in higher than expected, showing a fluctuation in March.
- Excluding shelter services, inflation rose to +4.77 percent year-on-year in March from +3.94 percent in February. This marks the fifth month out of the last six where it has accelerated on a year-on-year basis, now reaching its fastest pace since April 2023.
- Although the year-over-year increase in CPI ex-energy seems modest for now, it reached +3.57 percent year-on-year in March, compared to +3.54 percent in the previous month.
- The S&P 500 experienced its largest negative weekly close in six months, last week.
- Volatility has increased for the first time in 2024, with the CBOE Volatility Index closing above October 2023 levels.
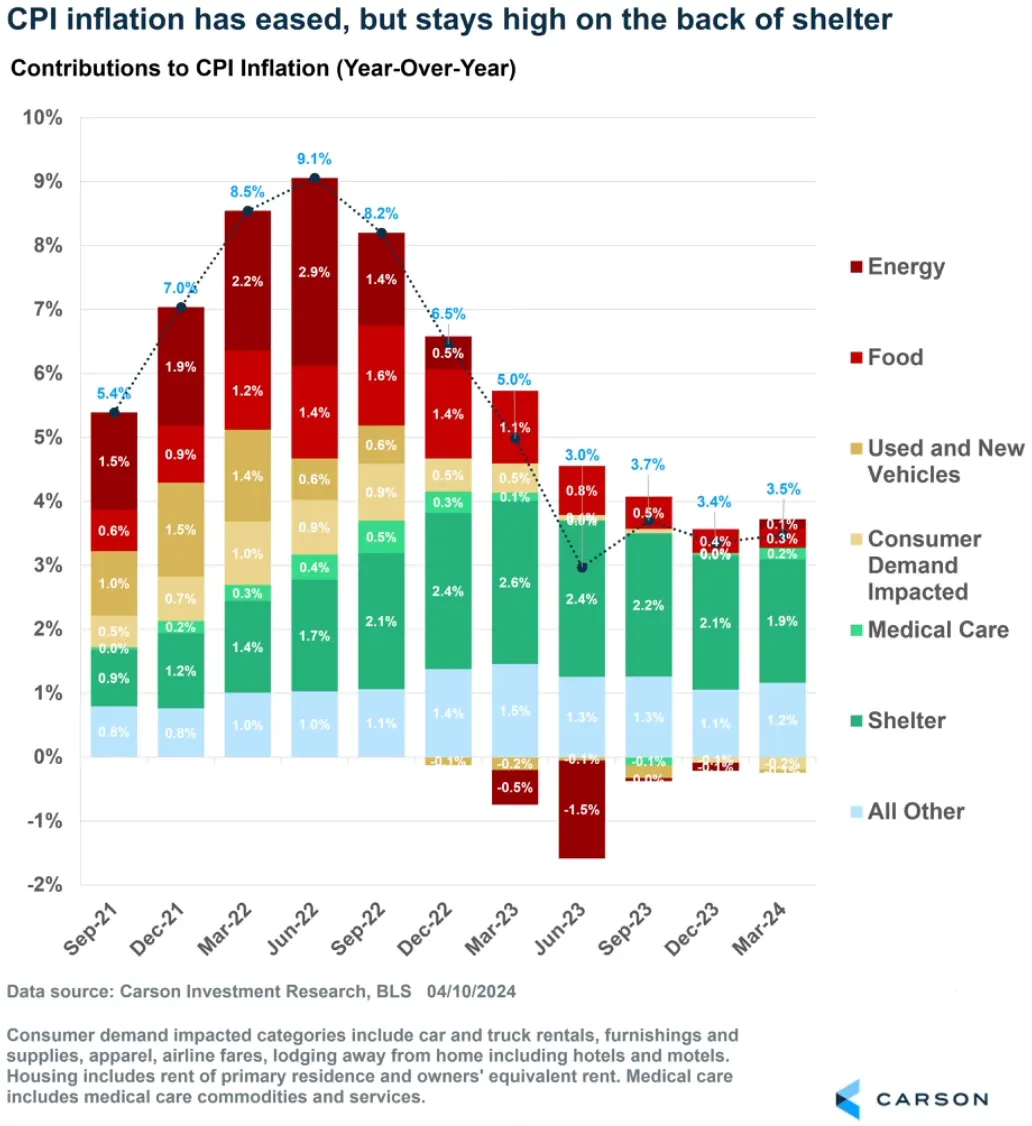
Currently, the data indicates that inflation is staying at a steady level, and the rate of disinflation is decreasing. Energy and commodity prices have been driving this trend, with oil prices rising by 26% since December.
Rising Inflation Good for Stocks?
However, increasing inflation doesn't always mean bad news for stocks. When we look at inflation outside of housing costs and compare it with the Nasdaq Composite index, we see that during times of inflation acceleration, the stock market tends to perform well. 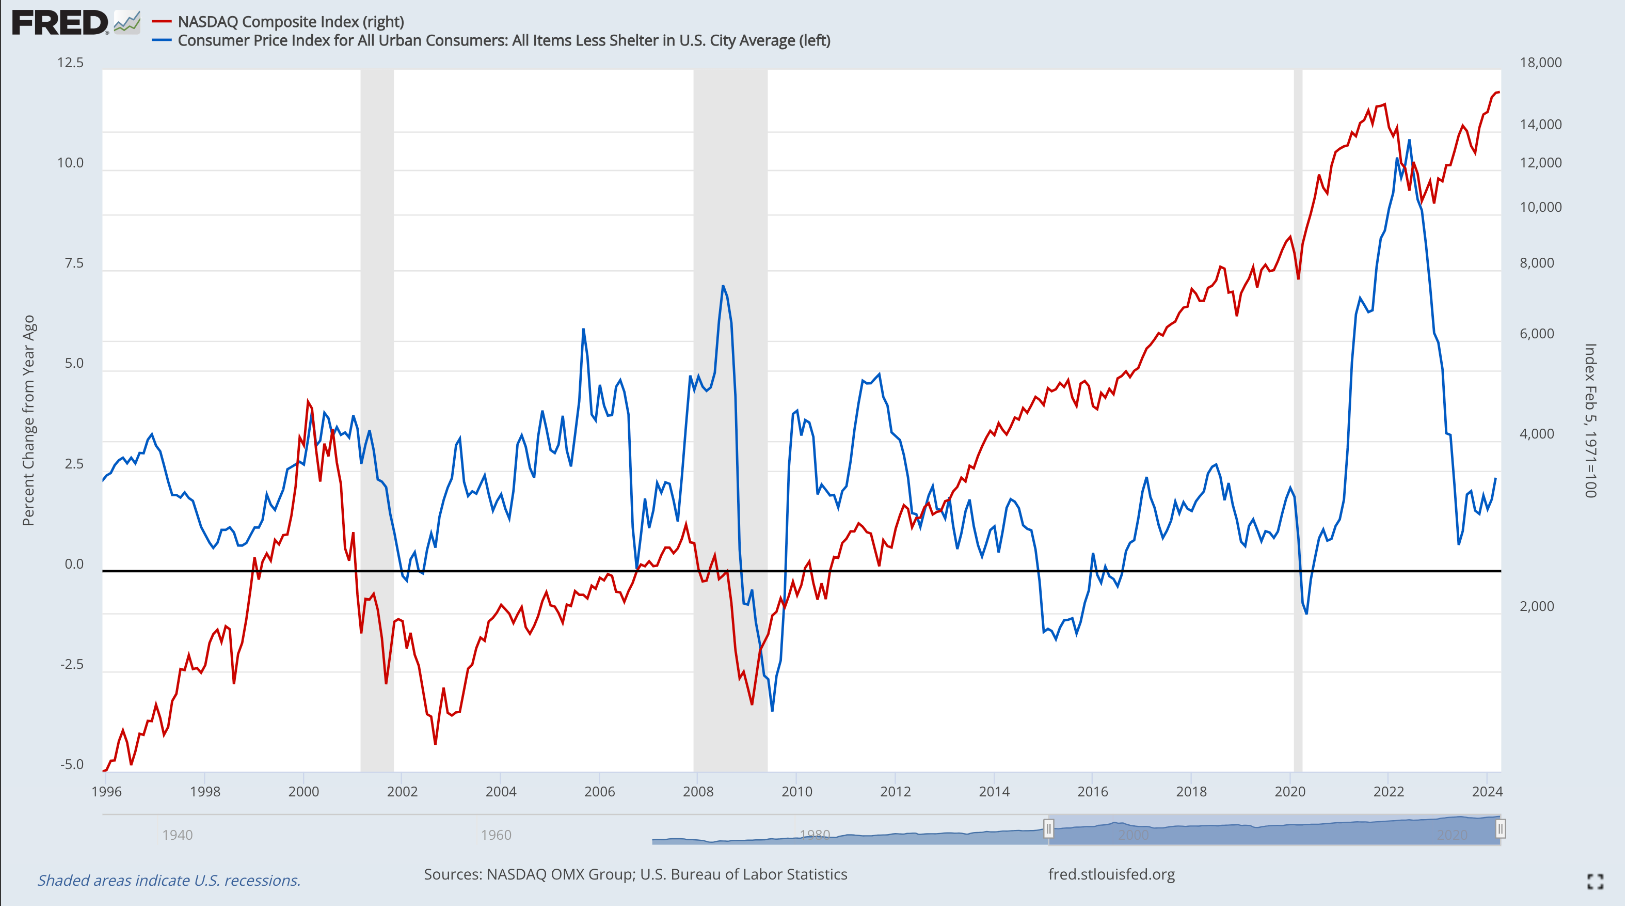
The report shows us that when inflation increases moderately alongside economic growth, it's actually good for stocks. So, there's a chance that inflation and the Nasdaq will both rise together, without inflation getting too high. Looking at data from 1995 to 2024, when inflation stayed below 5% annually, stocks generally kept going up.
Last Week's Decline: Pullback or Start of a Bear Market?
Considering the recent volatility, it's important to remember that pullbacks are a normal part of the market.
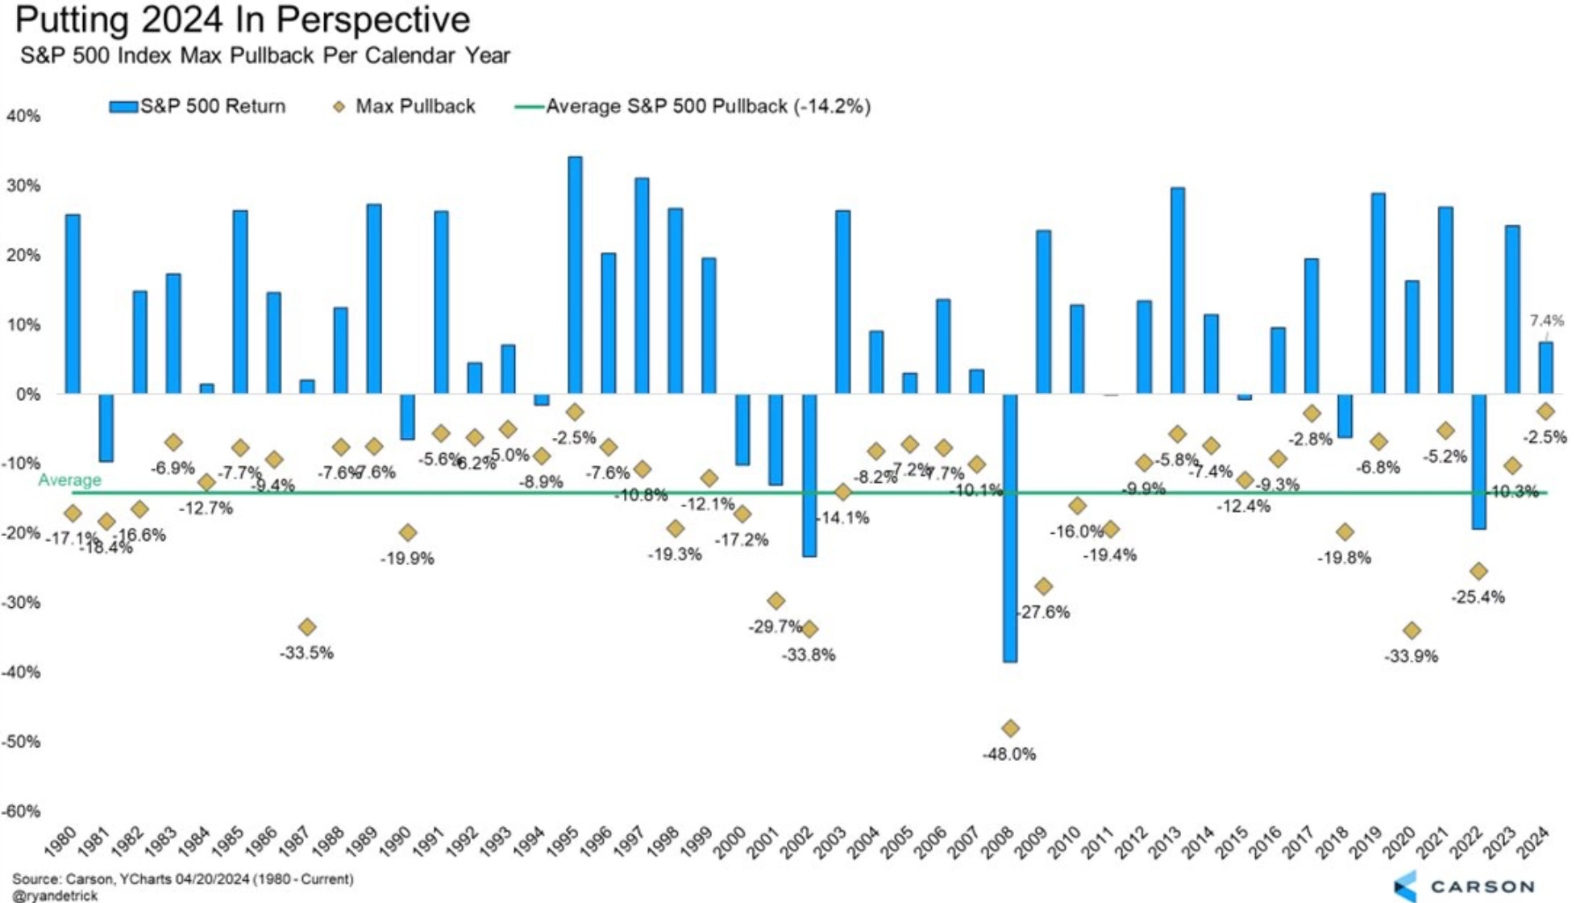
The chart displays the largest yearly decline in the S&P 500 and its average decline, standing at 14.2 percent. This year, in 2024, it's merely 2.5 percent, marking one of the lowest drops ever, akin to the slump observed in 1995. Comparatively, last year, despite a robust rally, stocks underwent a 10.2% correction.
Discussions often revolve around our position in this bullish cycle, with some suggesting it's too late and anticipating an imminent bubble burst. The tech-driven stock market rally is comparable to the catastrophic dotcom crash of 2000, which remains the only substantial bubble burst in the U.S. stock market post-World War II era.
This was attributed to soaring valuations that ultimately collapsed due to dismal revenue or earnings growth. However, today's tech sector is far from being as overpriced and is witnessing genuine growth in underlying earnings.
Simultaneously, the Global Equity Risk-Love index, currently at the 86th percentile, suggests that a short-term pause in equity markets wouldn't be surprising.
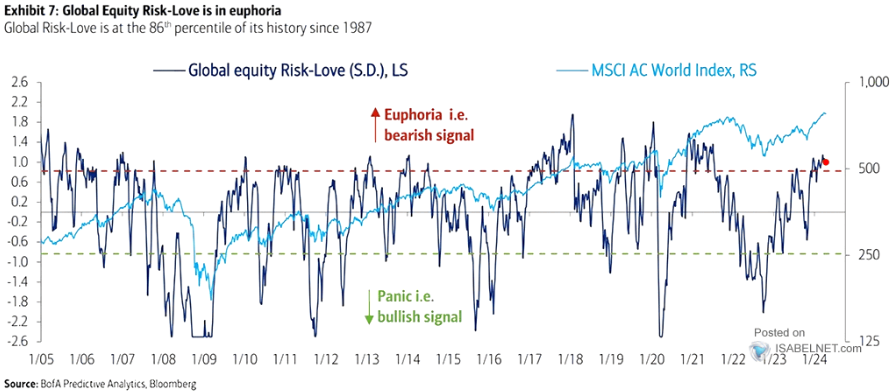
The chart displays the maximum yearly pullback of the S&P 500 and its average pullback. The indicator monitors various factors like manager positioning, put-call ratios, investor surveys, prices, volatility, spread, and correlations.
When the value reaches around 0.8 or higher, it indicates a state of "euphoria" in the global stock market. Conversely, if it fluctuates around -0.8 or below, it signals "panic" as the prevailing sentiment.
Considering multiple indicators, valuations, fundamentals, and sentiment, there is support for a potential short-term pullback. Currently, the ratio levels are at high points of optimism, suggesting increased short-term risk.
However, this doesn't rule out potential future upside, given the historical trend of persistently medium-high levels leading to continued positive trends in the following months.
The following chart indicates that we are currently in the middle phase of the bullish market cycle.
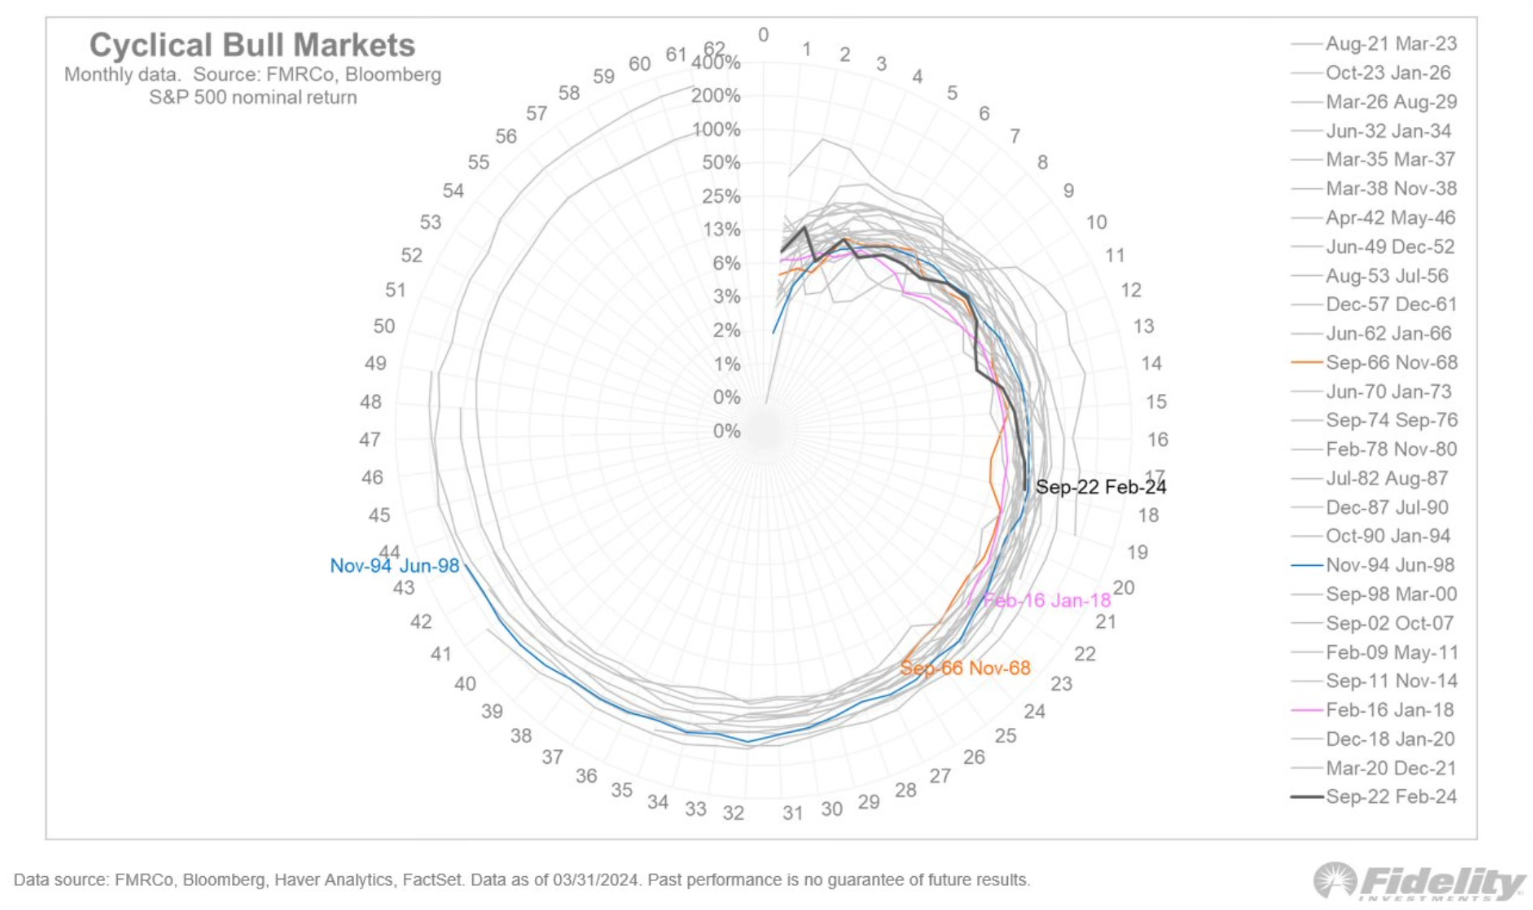
Fidelity's chart presents another perspective: the cycle is depicted as a clock. Currently, the clock reads 15:00 compared to the longest cycles in history. For the average cycle, it's at 18:00. In both scenarios, time currently favors the bulls.
***
Want to know the Fair Value of other stocks? Try InvestingPro+ and find out! Subscribe HERE and get over 40% off your annual plan for a limited time!

Disclaimer: This article is written for informational purposes only; it does not constitute a solicitation, offer, advice, or recommendation to invest as such it is not intended to incentivize the purchase of assets in any way. I would like to remind you that any type of asset, is evaluated from multiple points of view and is highly risky and therefore, any investment decision and the associated risk remains with the investor.
