👀 Ones to watch: The MOST undervalued stocks to buy right nowSee Undervalued Stocks

SPX 3000 On The Way?

Published 01/24/2018, 12:06 AM
Updated 07/09/2023, 06:31 AM
US500
-

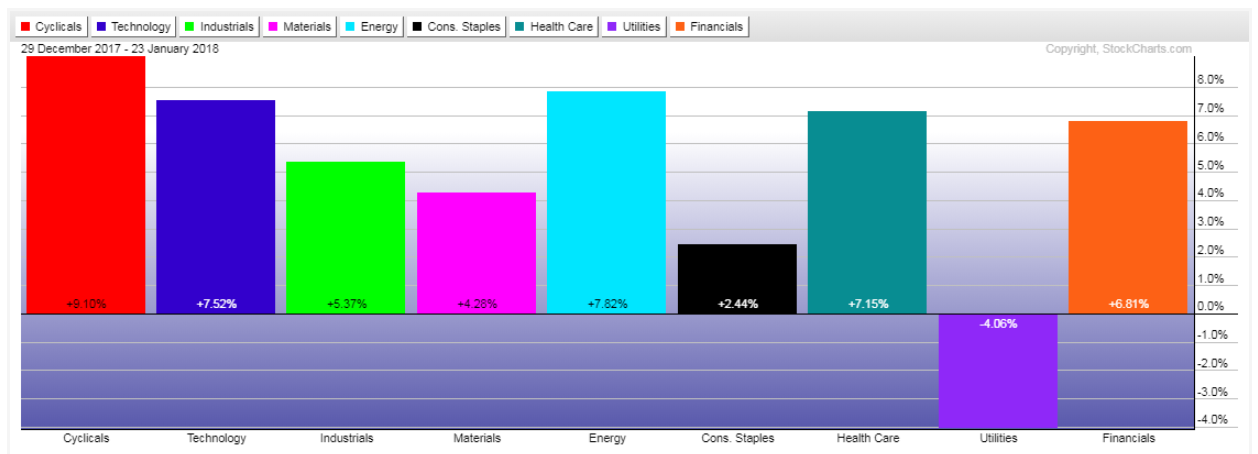
Year-to-date gains/losses made in the 9 Major Indices and 9 Major Sectors are shown on the graphs below...amazing gains for the S&P 500 after only 15 trading days.

The SPX is already over half-way to the 10% target I had forecast in this post for the entirety of 2018.
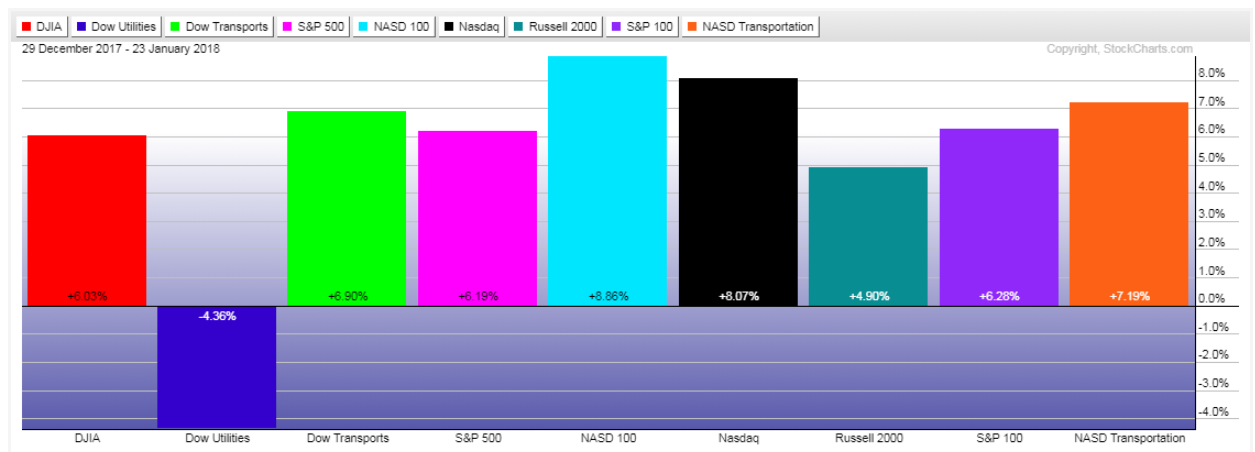
US Major Indices Performance 2018
SPX Sector Performance 2018

An extended outlook for the SPX sees major resistance at 3000 (its the next 'Big Round Number'), which is confluent with two external Fibonacci retracement levels (2984 and 3047), as shown on the monthly chart below.

When would it hit that level? It's anyone's guess, as anything seems possible in the current buoyant market environment. The momentum indicator is still rising on this long-term timeframe and is making new all-time highs in the process. Another 5% gain would send it up to that price, so we could be looking at a year-end target date to bring total gains of 11% by then...not an unreasonable expectation.

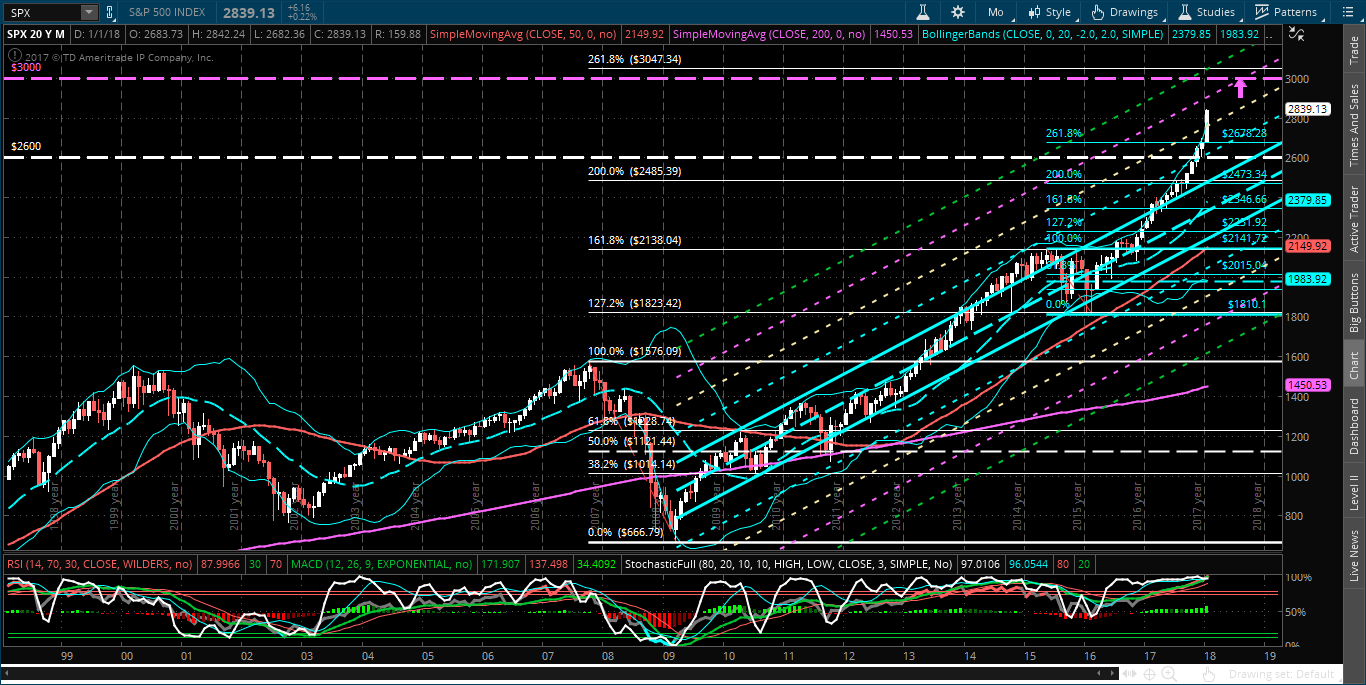
Another scenario is that it could reach that level around August of this year (pinpointed at the pink arrow shown on the second monthly chart below), which would put it at the +4 standard deviation level of a very long-term upward-sloping regression channel (beginning from the March 2009 low). That would give it plenty of "wiggle room" to allow for some price dips in between now and then. At the moment, price is in between the +3 and +4 standard deviation levels.

Other factors to monitor, in this regard, are outlined in my above-referenced market forecast post.
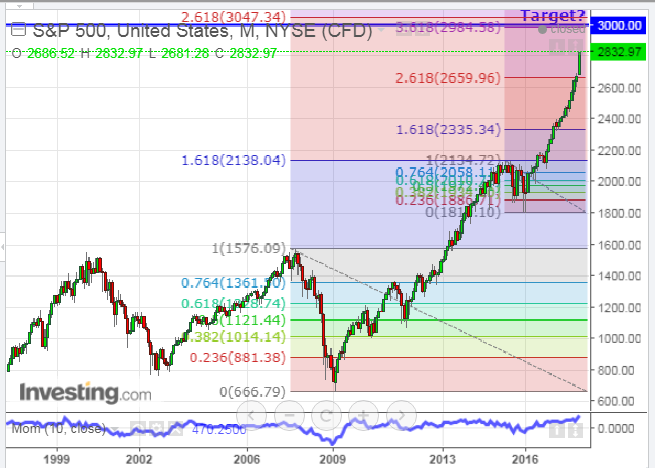
S&P 500 Monthly 1998-2018
SPX 20Y Monthly Chart

Latest comments

Loading next article…
Risk Disclosure: Trading in financial instruments and/or cryptocurrencies involves high risks including the risk of losing some, or all, of your investment amount, and may not be suitable for all investors. Prices of cryptocurrencies are extremely volatile and may be affected by external factors such as financial, regulatory or political events. Trading on margin increases the financial risks.
Before deciding to trade in financial instrument or cryptocurrencies you should be fully informed of the risks and costs associated with trading the financial markets, carefully consider your investment objectives, level of experience, and risk appetite, and seek professional advice where needed.
Fusion Media would like to remind you that the data contained in this website is not necessarily real-time nor accurate. The data and prices on the website are not necessarily provided by any market or exchange, but may be provided by market makers, and so prices may not be accurate and may differ from the actual price at any given market, meaning prices are indicative and not appropriate for trading purposes. Fusion Media and any provider of the data contained in this website will not accept liability for any loss or damage as a result of your trading, or your reliance on the information contained within this website.
It is prohibited to use, store, reproduce, display, modify, transmit or distribute the data contained in this website without the explicit prior written permission of Fusion Media and/or the data provider. All intellectual property rights are reserved by the providers and/or the exchange providing the data contained in this website.
Fusion Media may be compensated by the advertisers that appear on the website, based on your interaction with the advertisements or advertisers.
© 2007-2024 - Fusion Media Limited. All Rights Reserved.