Do you have exposure to small-cap equities? How do the small-caps measure up versus the large-caps at this moment?
There is always opportunity somewhere, and we do our best to find it. Not only in trading and business, but in life too. So, what can we find today in the markets?
Yesterday, the Russell 2000 closed above its 50-day simple moving average, a welcome sign for small-cap bulls. The index has lagged behind its large-cap counterparts as of late and hasn’t closed above its 50-day moving average since May 7.
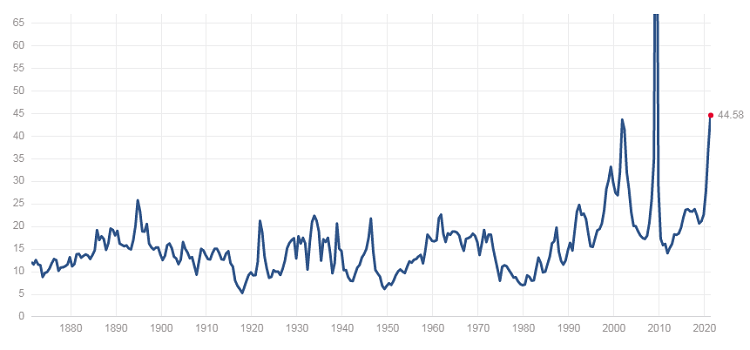
After taking the pulse of the markets and digesting the opinions of other participants, it can be challenging to get excited about an SPX at 4200 and with a 44.58 P/E ratio (trailing 12 months). So, more aggressive swing traders tend to look elsewhere in the hunt for return.
A quick note on the SPX P/E ratio (ttm):

- S&P 500 PE Ratio 1870 - 2021. Source multpl.com
Talk about a long-term chart. Anyway, this does look like a potential head-and-shoulders setup here. Although, it looks like current levels have exceeded the neckline. Food for thought. At what point is the S&P 500 fundamentally overvalued?
Let's get back to small caps.

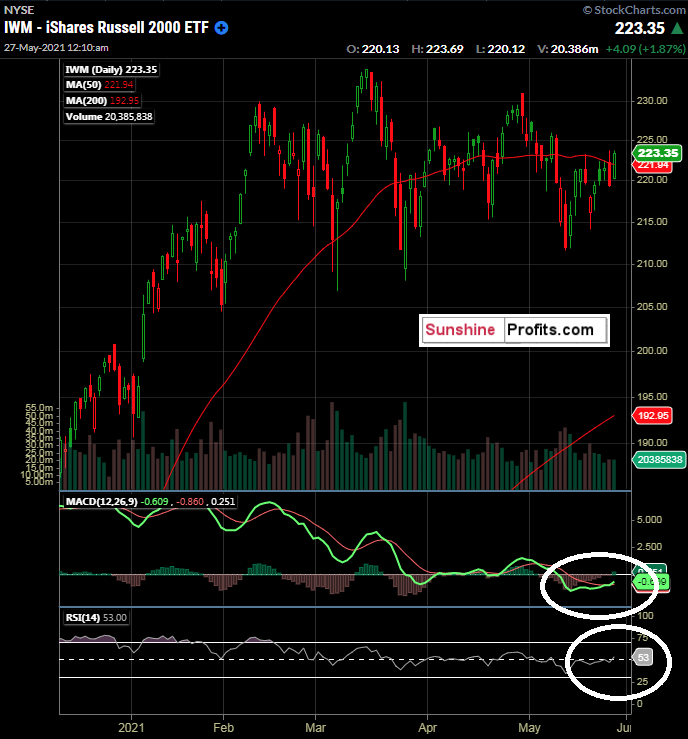
Figure 2 - IWM iShares Russell 2000 ETF December 10, 2020 - May 26, 2021. Source stockcharts.com
Above, we see the close above the 50-day moving average, the MACD (12,26,9) fast/slow line cross approaching the zero line, and the RSI(14) crossing 50. This, my friends, is visual Mozart to me; a confluence of indicators. Of course, nothing works all of the time, but when multiple technicals can be stacked in your favor, a distinct advantage can be created.
Wednesday’s settlements had the SPDR® S&P 500 (NYSE:SPY) up 0.20% on the day, the SPDR® Dow Jones Industrial Average ETF Trust (NYSE:DIA) up 0.03%, the Invesco QQQ Trust (NASDAQ:QQQ) up 0.35%, and the iShares Russell 2000 ETF (NYSE:IWM) up 1.87%. A whopping change in tune from the recent large-cap money flow theme. It is certainly worth noting and perhaps utilizing for adjustment and/or speculation.
Why Were Small-Caps Up So Much Comparatively On Wednesday?
One thing to know is that the Russell indices are reconstituted yearly in June. This reconstitution is designed to remove underperforming stocks from the index and add new stocks to the index. The goal is to have and maintain a more accurate representation. This process begins on June 4, 2021, and ends with the reconstituted index ready on June 25. The new index components take effect after the market closes on June 25, which would be for Monday’s open on June 28.
Isn’t This A Valuable Nugget?
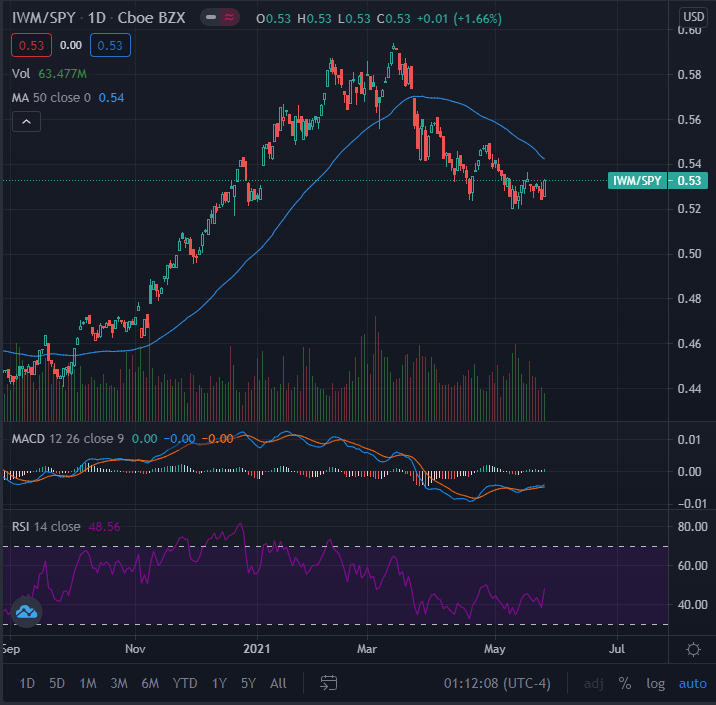
Another viable way to play the Russell reconstitution would be to pair it with another index ETF like SPY. If you are overall bearish on the market, this could be a great way to reduce risk, and still participate in the “Russell reconstitution trade.”
Take a look:

Figure 3 - IWM iShares Russell 2000 ETF / SPY S&P 500 ETF Ratio August 27, 2020 - May 26, 2021. Source stockcharts.com
This chart is the IWM divided by the SPY – the IWM-to-SPY ratio. You can see that the small-cap index had fallen out of favor versus the large-cap index from March until now. Again here, we see the MACD looking to tilt bullish and the RSI(14) looking to bullishly cross the 50 line.
So, this can be a way to take advantage of the Russell Index reconstitution even if you are bearish. This can be achieved by buying IWM and selling SPY, on a dollar-for-dollar basis. It is a way to look for one index to outpace the other (or not decrease as much as the other). Got it?
