Here’s a number for you – 88%. Since 1948, over any 10-year period the Dow Jones Industrial Average has showed a gain 88% of the time. That’s a pretty good number. It also explains why we should give bull markets the benefit of the doubt (for the record, if you only hold the Dow between the end of October and the end of May every year you would have a showed a 10-year gain 98% of the time! But this article is not about seasonality per se, so that’s a topic for another day).
Of course, there is a lot of variability along the way, and if you Google (NASDAQ:GOOGL) “current signs of a bear market” you come up with 4,280,000 articles to peruse. So, few investors ever feel “contented”. We’re always waiting for the “other shoe to drop.”
Some Warning Signs To Look For
#1. Major Indexes
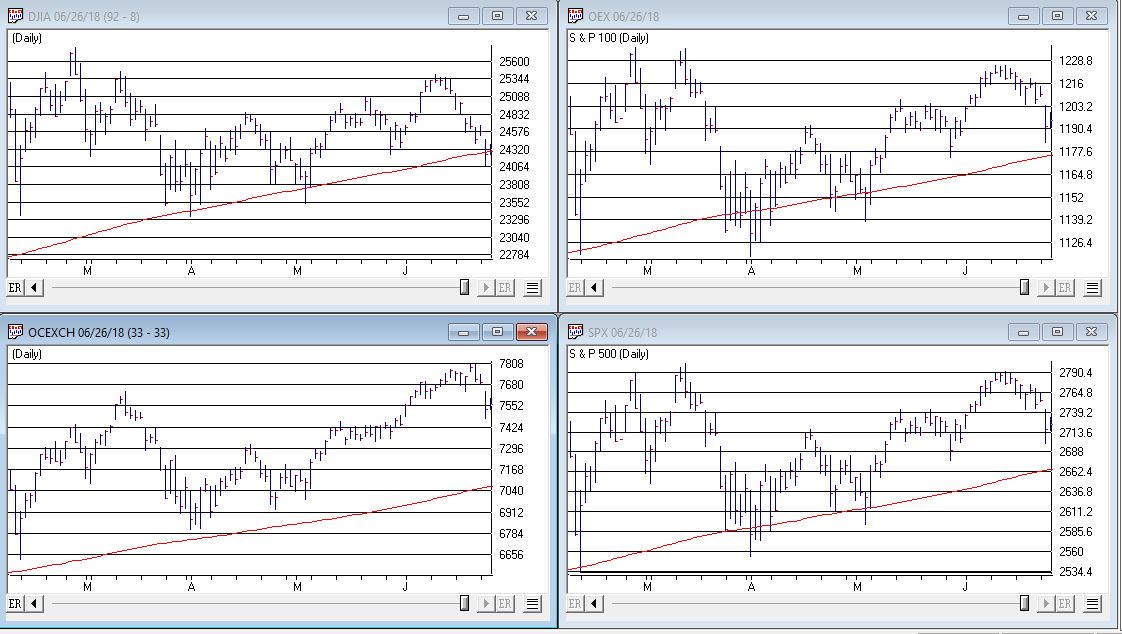
Figure 1 displays the four major average – Dow, S&P 500, Nasdaq 100 and Russell 2000 with their respective 200-day moving averages. In the last few days the Dow slipped a little below its 200-day average, the other three remain above.

Figure 1 – Four major market averages with 200-day moving averages (Courtesy AIQ TradingExpert)
Warning Sign to Watch For: If 3 or more of these averages drop below their 200-day moving average.
#2. Market Bellwethers
Figure 2 displays my four market “bellwhethers” – tickers VanEck Vectors Semiconductor (NYSE:SMH) (semiconductors), TRAN (Dow Transports), ZIV (inverse VIX) and Sotheby’s (NYSE:BID) (Sotheby’s Holdings) with their respective 200-day moving averages. At the moment only ZIV is below it’s 200-day moving average but some of the others are close
Figure 2 – Four market bellwethers with 200-dqy moving averages (Courtesy AIQ TradingExpert)
Warning Sign to Watch For: If 3 or more of these averages drop below their 200-day moving average.
#3. S&P 500 Monthly Method
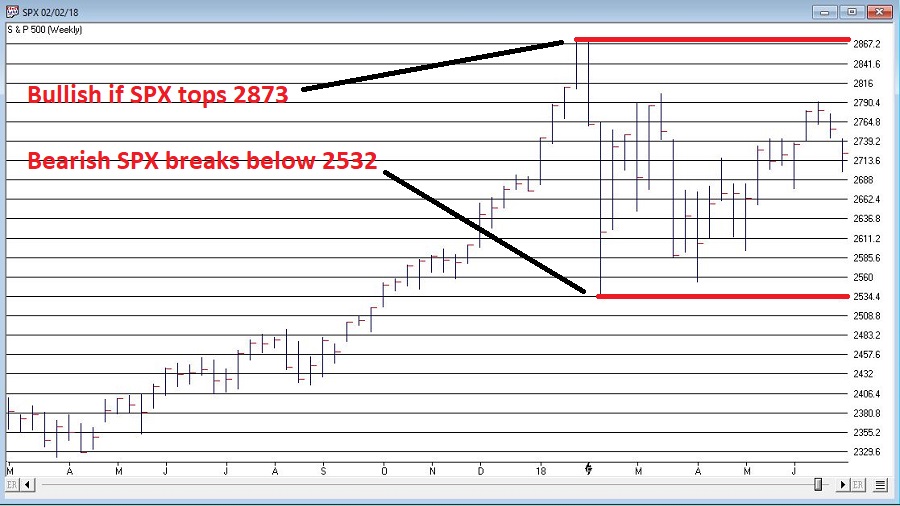
In this article I detailed a simple timing method using S&P 500 Index monthly closing prices. Figure 3 show the S&P 500 Index with it’s “trigger warning” price of 2,532.69 highlighted.
Figure 3 – S&P 500 Index Monthly Method Trigger Points (Courtesy AIQ TradingExpert)
Warning Sign to Watch For: If SPX closes below 2532.69 without first taking out the January high of 2872.87
#4. International Growth Stocks
When growth stocks around the world are performing well, things are good. When they top out, try to rebound and then fail, things are (typically) not so good. The last two major U.S. bear markets were presaged by a break in ticker Vanguard International Growth Inv (Vanguard International Growth) as seen in Figure 4.
Figure 4 – Dow Jones Industrials Average (top) and previous warnings from ticker VWIGX (bottom)(Courtesy AIQ TradingExpert)
Warning Sign to Watch For: Technically this one is currently flashing a warning sign. That warning will remain active unless and until VWIGX takes out the January high of 33.19.
#5. The 10-Year minus 2-Year Yield Spread
This is one of the most misrepresented indicators, so I will state it as plainly as possible:
*A narrowing yield curve IS NOT a bearish sign for the stock market
*An actual inverted yield curve IS a bearish sign for the stock market
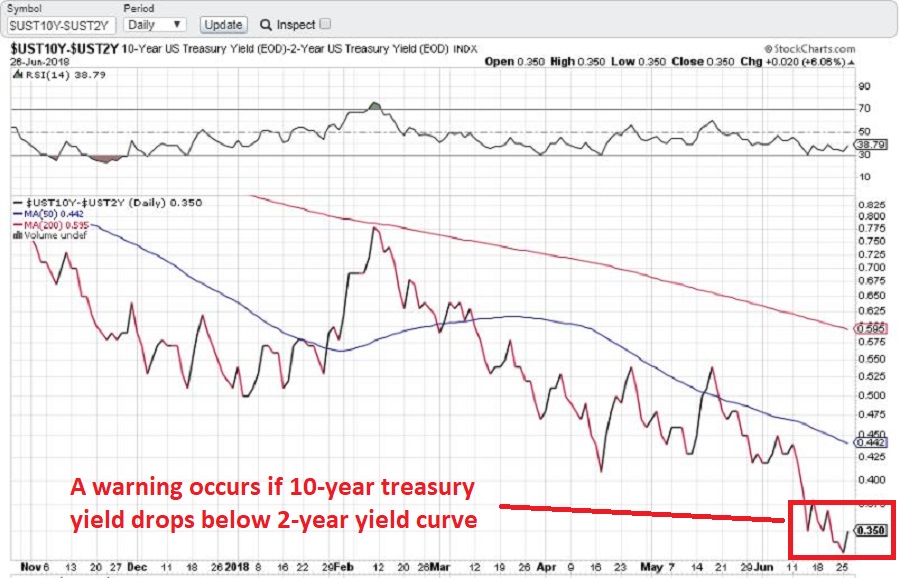
Figure 5 displays the latest 10-year minus 2-year spread. Yes, it has narrowed quite a bit. This has launched a bazillion and one erroneously frightening articles. But remember the rules above.
Figure 5 – 10-year treasury yield minus 2-year treasury yield (Courtesy: www.StockCharts.com)
Warning Sign to Watch For: If the 10-year yield minus the 2-year yield falls into negative territory it will flash a powerful warning sign for the stock market and the overall economy. Until then ignore all the hand-wringing about a “flattening” yield curve.
Summary
We are in a seasonally unfavorable period for the stock market and – as always – we are bombarded daily with a thousand and one reasons why the next bear market is imminent.
So my advice is to do the following:
1. Ignore it all and keep track of the items listed above
2. The more warning signs that appear – if any – the more defensive you should become
In the meantime, try to go ahead and enjoy your summer.


