While Brexit settled, stimulus checks in the US were debated and Alibaba (NYSE:BABA) got their hand (stock) slapped, a few other events that did not make headlines occurred.
First, corn, soybean and sugar futures all advanced to new multi-month highs.
Secondly, as if without a care in the world, junk bonds also made a new high since the end of February.
High grade bonds (LQD) although not as sexy as the junk bonds, went to a historical yield low of 1.8%.
The U.S. dollar, although a bit higher than its multiyear low as of Thursday, remains quite weak.
Oil (United States Oil Fund (NYSE:USO) had a golden cross, heading into a bullish phase on the daily charts.
This is the first time we have seen a bullish phase in oil since December 2019.
And this happened in spite of the plethora or negative headlines about the demise of oil.
One reason is that demand is expected to increase as the vaccine becomes more readily available.
But we cannot help think that there might be some other yet to be discovered reason.
As chartists, we believe that the technical analysis is truly the peek into the crystal ball that something newsworthy is upcoming.
Yet, back to the point.
The Money Supply rocketed 25% in the last two weeks.
How long have we talked about the comparisons from the 1970’s to now?
In the late 1970’s (yes that period of stagflation you all have heard Mish and MG talk about), checking deposit growth outpaced saving deposit growth. That 25% growth in money supply reflects the US banking system’s checking accounts.
But let us not get too bogged down on the stats.
Consumer price inflation has already risen. And the surge in food commodities has followed in kind.
The long bonds, although under pressure, refuse to quite and appear one good safety sneeze away from rallying.
Put this all together and it’s not Bitcoin we are thinking about right now, although we have been long with a current trailing stop.
We are amazed that gold has languished…to this point.
silver has outperformed (another inflation indicator).
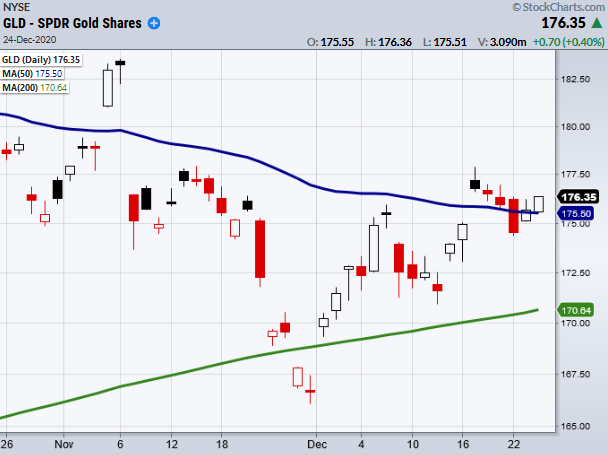
In the chart of gold (SPDR® Gold Shares (NYSE:GLD))) the price sits on the 50-DMA. It also sits above a key weekly exponential moving average.
The volume has not wowed yet.
However, the price action signals that a bottom, or at least a really good risk/reward ratio, is in.
That tells us, if the analysis is correct, we could be looking at much higher as we head into 2021.
If you are curious about our market timing, we invite you to follow us on Instagram (mishschneider) and twitter (@marketminute) where you can watch a 30 second video each morning. The morning of Christmas Eve Day was about gold.
In the meantime: May your holidays be healthy, happy and golden…..
Regards from the MarketGauge Family
Key Levels
S&P 500 (SPY) Flirting around the 10-DMA at 138.38. 372.46 to clear.
Russell 2000 (IWM) Looking to break the 200-price level.
Dow (DIA) 275 key resistance to clear.
NASDAQ (QQQ) Support 297.42 to 303.80 resistance.
KRE (Regional Banks) support 49.68.
SMH (Semiconductors) 201.41 support. Needs to clear the 10-DMA at 215.45.
IYT (Transportation) 223.24 to clear with 219.09 support.
IBB (Biotechnology) Holding a strong up trend in line with the 10 day moving average.
XRT (Retail) Almost the same close as yesterday. Holding.
