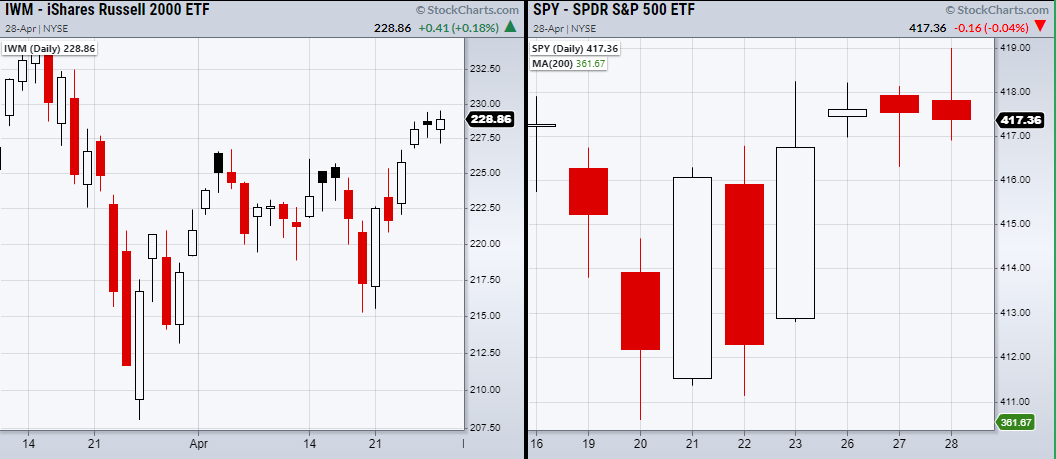
The first half of Wednesday saw minimal movement in the major indices, due in large part to the anticipation for the FOMC minutes that were released later that day.
However, like the prior FOMC report, it stuck to the same slate of ideas.

Interest rates will stay near zero and increasing inflation is fine as the economic recovery stays in the Fed's spotlight.
This was a positive signal for the market that sparked an unexciting level of late-day buying.
In terms of the market movement, the Russell 2000 iShares Russell 2000 ETF (NYSE:IWM) closed over Tuesday's opening price while the S&P 500 SPDR® S&P 500 (NYSE:SPY) had a slim break out to new highs before settling just under its prior day's close.
With that said, the market has yet to make any substantial moves in either direction, with a large number of earnings reports still to be released through the remainder of the week.
It can be tough to predict the behavior of an equity’s price action after earnings, since positive earnings reports can still trigger selling if investors were expecting additional gains or growth from the report.
This can be seen in Microsoft (NASDAQ:MSFT) which reported beyond analyst's expectations, yet sold off on Wednesday.
Although this is just one example, it shows that from a technical side, earnings are often best to steer clear from unless they are specifically involved in your trading strategy.
This is possibly another reason for the lack of overall market volume as investors are sitting patiently until the thick of the earnings season is over.
ETF Summary
- S&P 500 (SPY) Needs to hold over 418.25.
- Russell 2000 (IWM) Looks good if holds over 226.69.
- Dow (DIA 342.43 high to clear.
- NASDAQ (QQQ) 342.23 high to clear.
- KRE (Regional Banks) Support 66.95.
- SMH (Semiconductors) 242.41 support the 50-DMA.
- IYT (Transportation) Closest support the 10-DMA at 264.39.
- IBB (Biotechnology) 154.68 support.
- XRT (Retail) Like this to hold over the 10-DMA at 92.24.
- Volatility Index (VXX) Doji day.
- Junk Bonds (JNK) Held the 10-DMA at 108.99.
- XLU (Utilities) Watching to hold over todays low at 65.29.
- SLV (Silver) support 24.05.
- VBK (Small Cap Growth ETF) 288.11 support.
- UGA (US Gas Fund) Needs to hold over 33 as new support.
- TLT (iShares 20+ Year Treasuries) Flirting with the 50-DMA at 138.73.
- USD (Dollar) Next support area at 90.00.
- MJ (Alternative Harvest ETF) Held the 10-DMA at 21.03.
- LIT (Lithium) Support the 10-DMA at 62.36.
- XOP (Oil and Gas Exploration) Watching for second close over the 50-DMA at 81.72.
- DBA (Agriculture) 18.75 next main resistance area from 80-month moving average.
