Over a long enough period of time, value stocks tend to outperform growth stocks and this fact is causing some pain for the value oriented investor during this market cycle. In a Fidelity article that compares value versus growth performance, this has indeed been the case when going back over 25 years. The Fidelity article shows, however, that on a risk adjusted basis the growth style wins out. The value style tends to have a large weighting in financial and economically sensitive sectors and most investors know these types of sector positions experienced headwinds in the 2008/2009 economic downturn.
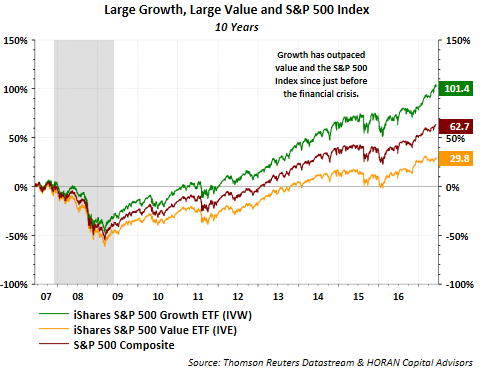
What has driven the outperformance of the large cap growth style has been the growth style's overweight to technology stocks. Many economically sensitive sectors that dominate the value style would tend to do well when coming out of a recession like after 2009. However, growth's nearly 25% technology sector overweight versus value, and technology's 73% return in 2009, overwhelmed the strong return in the value index's sector overweights.
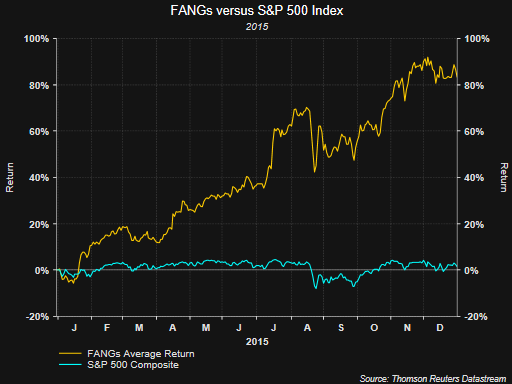
It seems the investors' focus over the last five plus years has been on the FAANG basket of stocks, Facebook (NASDAQ:FB) Amazon (NASDAQ:AMZN), Apple (NASDAQ:AAPL), Netflix (NASDAQ:NFLX) and Alphabet (NASDAQ:GOOGL) of Google. We discussed in an article in 2016 that highlighted the strong returns of the FANG basket of stocks in 2015. We characterized the 2015 market as one where a momentum or growth strategy outperformed. As one can see in the chart below that was included in the 2016 article, the FANG basket did not move higher in a straight line in 2015 and the average return of the basket was down over 20% in August of that year.
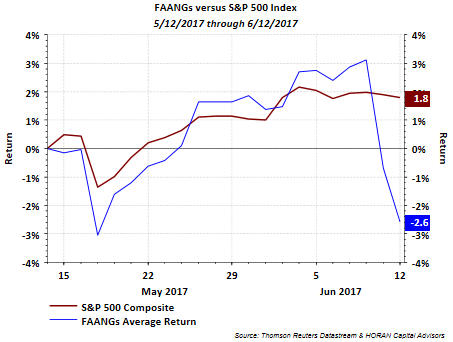
Trading over the past two days (Friday and Monday) was focused on technology and internet related stocks. The below chart represents the FAANG basket's average return over the past 30 days and the over 5% average decline is certainly evident.
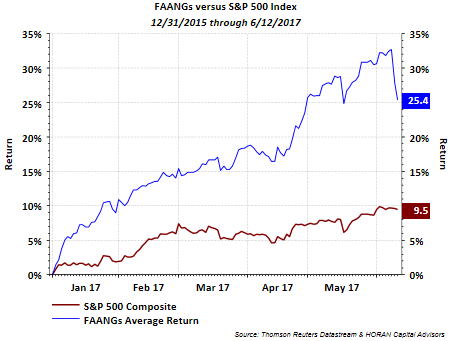
On a year to date time frame, the FAANG pullback looks steep, but the basket's average return still exceeds 25%.
What has been unique in the market is the absence of any significant pullback, i.e., a pullback of simply 5%. Even today, the individual investor seemed attracted to the the FAANG stocks and a few other technology favorites of this cycle. The below table shows the most active stock trades from Fidelity's online investors. Plenty of technology stocks are represented in the top 10 active positions.
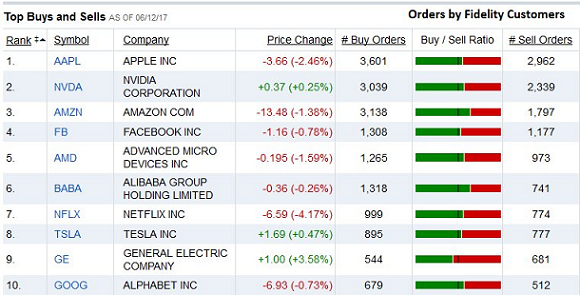
Source: Fidelity
It certainly seems as though the growth trade is due for a rest and the prior 30 day performance is providing some support for this line of thinking.
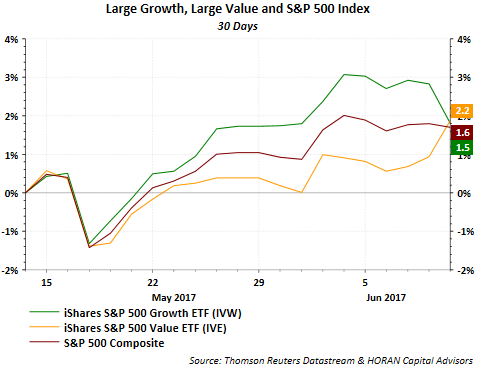
However, in a slow growth economic environment, it is growth type stocks that tend to generate earnings growth in spite of the overall economy. I highlighted this rotation back into growth in a post in mid-May, Momentum Strategy Leading Again. The summer months tend to be more volatile, so investor patience should be rewarded as more market choppiness would provide investors with investment opportunities.
Disclosure: Long AAPL and GOOGL
