
In the lead up to and after the November election a significant change in stock leadership has been underway. The better performing sectors are those that will benefit from faster economic growth and a steeper yield curve (like the banks.) Seemingly left behind, or at least underperforming, are the technology stocks as can be seen in the below sector performance chart. 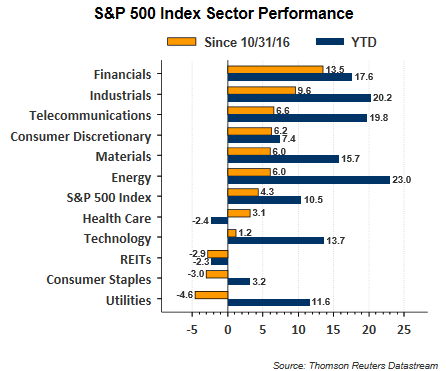
One area of technology that generated out sized returns in 2015 was related to internet and social media companies. The favored group of stocks called the FANGs (Facebook (NASDAQ:FB), Amazon.com (NASDAQ:AMZN), Netflix (NASDAQ:NFLX) and Alphabet Inc (NASDAQ:GOOGL) were a beneficiary. The below chart shows the significance of the 2015 FANG returns. 
Given the strength of the FANGs return in the couple of years leading up to the end of 2015, the fact they have kept pace with the market in 2016 is somewhat a sign of investors continued interest this group of stocks. 

Back to the change in stock leadership that is underway this month, the FANGs have not been immune to weakness relative to the broader market. The rotation that has occurred since the election is seeing flows into value/cyclically oriented stocks versus growth stocks that tend to trade at a higher price earnings ratio or valuation multiple. Each of the four FANG stocks are underperforming in November and is this indicative of the beginning of a longer term trend? 
One measure an investor can use in evaluating stocks is to compare a stocks P/E to its expected earnings growth rate, the PEG Ratio. P/E is a company's price per share divided by earnings per share. The lower a company's PEG ratio the cheaper the stock relative to the company's earnings growth.
- P/E = Price Per Share/Earnings Per Share
- PEG Ratio = (P/E)/Earnings Per Share Growth Rate
The importance of comparing PEGs across different stocks or sectors is the PEG enables an investor to uncover stocks that may trade at relatively high P/Es because the company's earnings are expected to grow at a faster rate than maybe a lower P/E stock. As can be seen in the below chart, the FANGs' PEG ratio is lower than that of the broader S&P 500 Index and the technology sector itself. 
Based on the PEG alone, and in spite of the high PE multiple, the market is expecting faster earnings for this basket; thus, rewarding the stocks with a higher P/E. Working against higher valuation stocks at the moment though is the market's anticipation that economic growth will quicken in the coming year or so. This is leading to investors rotating into more economically sensitive stocks that tend to trade at lower valuations or PEs in anticipation of faster earnings growth.