Led by oil, the world’s risk-on assets are beginning what could be a fairly significant bear market rally. Bear market rallies tend to be quite violent. They often end very quickly, without warning.
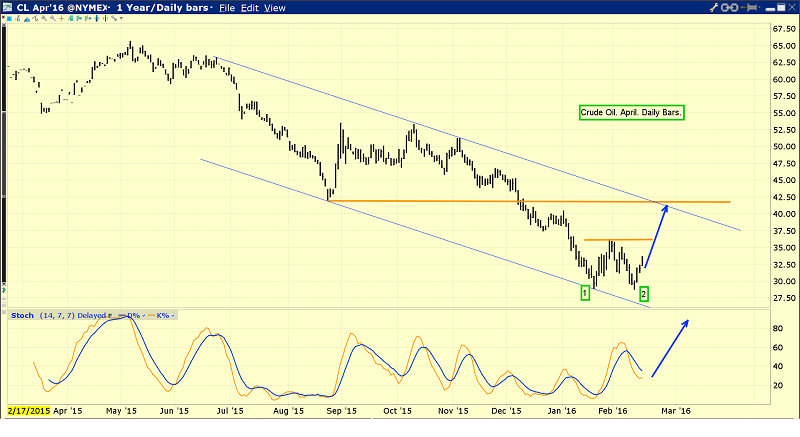
There’s a double bottom pattern in play on this daily bars oil chart.
Oil is one of the world’s great risk-on assets, and its price action can be a good lead indicator for other risk-on assets, like the US dollar and the Dow.
While production quotas may do more long term harm than good, in the short term, they are fuelling a strong rally in the price of oil.
Basis Dow Theory, the US stock market fell into a bear market last week. The Dow Industrials closed below their August closing low. The Industrials could stage a dramatic rally now, but unless the Transports stage an even better performance, a bear market rally is all this will be.
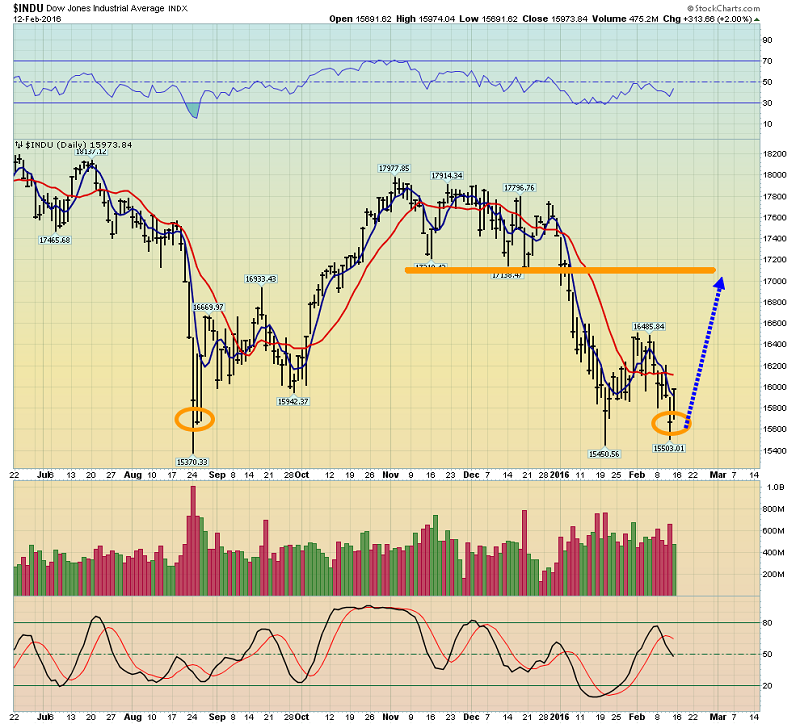
Recently, this daily bars chart of the Dow has shown great similarity to the oil chart.
It’s hard to know exactly how high the Dow could go on this rally, but it would not surprise me to see the Industrials make a marginal new high, while the Transports fail to do so.
Most analysts are very concerned about the Chinese economy, but I think some of those concerns have been created by predatory hedge funds who have made large bets against Chinese markets.
The Chinese economy is suffering “transition pain”, as it moves from an exports-oriented theme, to one of domestic consumption. Growth may be less than what is officially stated in China, but bank loans are strengthening, and that’s adding fuel to the global markets risk-on rally.
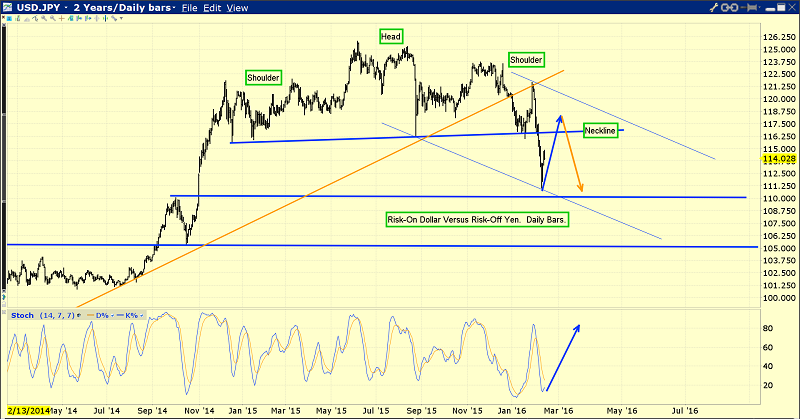
That’s the daily bars chart of the US dollar against the Japanese yen. The US dollar is the world’s largest risk-on market, and it is currently rallying towards the neckline of a huge and bearish head and shoulders top pattern.
Most amateur investors think the US dollar is a risk-off trade, but major forex players know it’s part of the risk-on sector. Japan is the world’s largest creditor, and its savvy citizens are phenomenal savers. In contrast, the United States is the world’s largest debtor, and the citizens tend to embrace excessive debt as a kind of “moral good”. That’s not a good thing, to put it mildly.
As professional investors try to get in on the risk-on assets rally, that’s putting some pressure on gold, which is the most important risk-off asset.
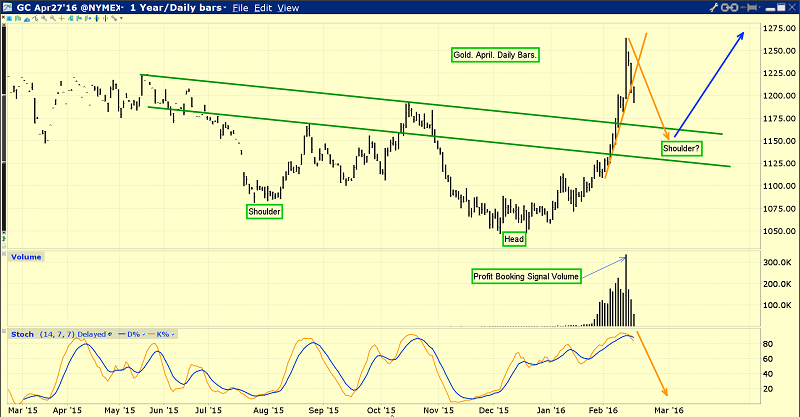
That’s the daily bars gold chart. The power uptrend line was snapped by the surge into risk-on assets, and the decline may be forming the elusive right shoulder of large inverse head and shoulders bottom pattern.
Top analysts at Deutsche Bank) have the same view I do about the bear market in most global equity markets. If the Fed hikes 3 – 4 times this year, as I’m predicting, risk-on assets could begin to stage a bear market meltdown that is reminiscent of 1929.
Goldman’s top commodity economist is Jeff Currie. He’s also predicting 3 rate hikes this year. He argues that will pressure gold to the $1000 area before a major upcycle in oil begins later this year. He believes that upcycle would unleash a major rise in almost all commodities, following oil’s lead.
I understand Jeff’s viewpoint. I have tremendous respect for his abilities, and for the liquidity flows he can create with his statements, but he thought gold would tumble when the Fed raised rates. Instead, exactly as I predicted, rate hikes created a panic out of lead risk-on markets like the Dow and the dollar. That created a huge surge into the lead risk-off markets of gold and the yen.
I don’t think Bloomberg has all the facts about what is happening in India. There is a lull in buying, but the gold price rally is only part of the reason for that lull. In the bigger picture, the national budget is scheduled for release within about two weeks. Most jewellers expect the gold import duty to be cut from 10% to the 2% - 4% range.
Against the background of a serious rally in the gold price and the prospect of a duty cut, most Indian buyers have ceased their buying, and they will stay in “cold” mode, until that budget is released.
Tactics? The Western gold community needs to prepare for the unexpected, and gold certainly could trade in the $1000 area, as Jeff Currie predicts it will. In the current situation, put options on gold, bought as portfolio insurance, are a fearful investor’s best friend.
If Janet Yellen raises rates repeatedly and relentlessly, like both Jeff Currie and I are predicting, he may be correct that gold declines to $1000 before moving higher, or I may be correct that risk-on assets resume their bear market, and gold and the yen stage powerful rallies. Put options keep the investor protected, yet in the upside game, regardless of whether Jeff’s scenario or mine is the one that happens.
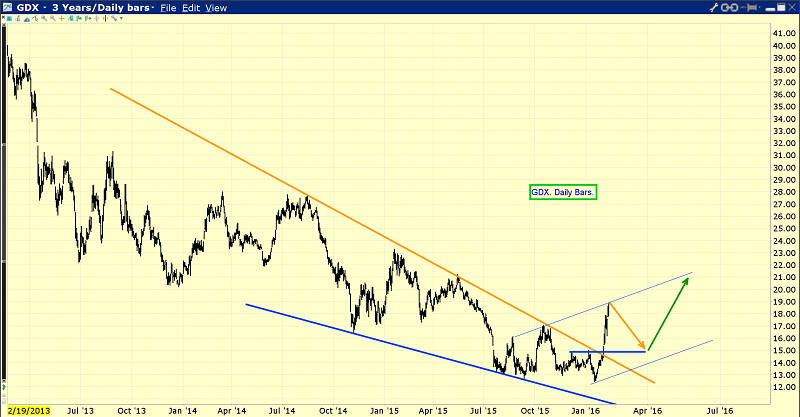
This is the phenomenal Market Vectors Gold Miners (N:GDX) daily bars chart. I suggested that GDX would stage a violent upside rally from the wedge pattern, and that has happened.
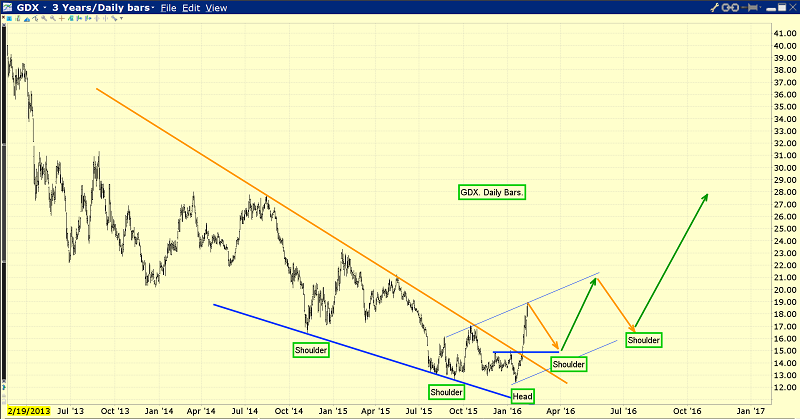
A budding major uptrend is now in play, and so is a potentially very bullish inverse head and shoulders bottom pattern. The price action is superb, and as more right shoulders are formed, GDX should move steadily higher.
Gold stocks get a “bad rap” from the mainstream community (MC), but the reality is they are part of the risk-off gold market. Gold mining itself is inherently risky, because the product mined is so difficult to find. That doesn’t change the fact that the gold sector is a risk-off market, and gold stocks will be bought as institutions pour out of risk-on markets like the dollar and the Dow!
Risks, Disclaimers, Legal: Stewart Thomson is no longer an investment advisor. The information provided by Stewart and Graceland Updates is for general information purposes only. Before taking any action on any investment, it is imperative that you consult with multiple properly licensed, experienced and qualified investment advisors and get numerous opinions before taking any action. Your minimum risk on any investment in the world is: 100% loss of all your money. You may be taking or preparing to take leveraged positions in investments and not know it, exposing yourself to unlimited risks. This is highly concerning if you are an investor in any derivatives products. There is an approx $700 trillion OTC Derivatives Iceberg with a tiny portion written off officially. The bottom line:Are You Prepared?
