The year goes quickly, non? We're already a quarter and a day along the way. And who remains our star performer "On Broadway"--(The Drifters, '63)? 'Tis Gold! Here are the year-to-date BEGOS Market Standings:
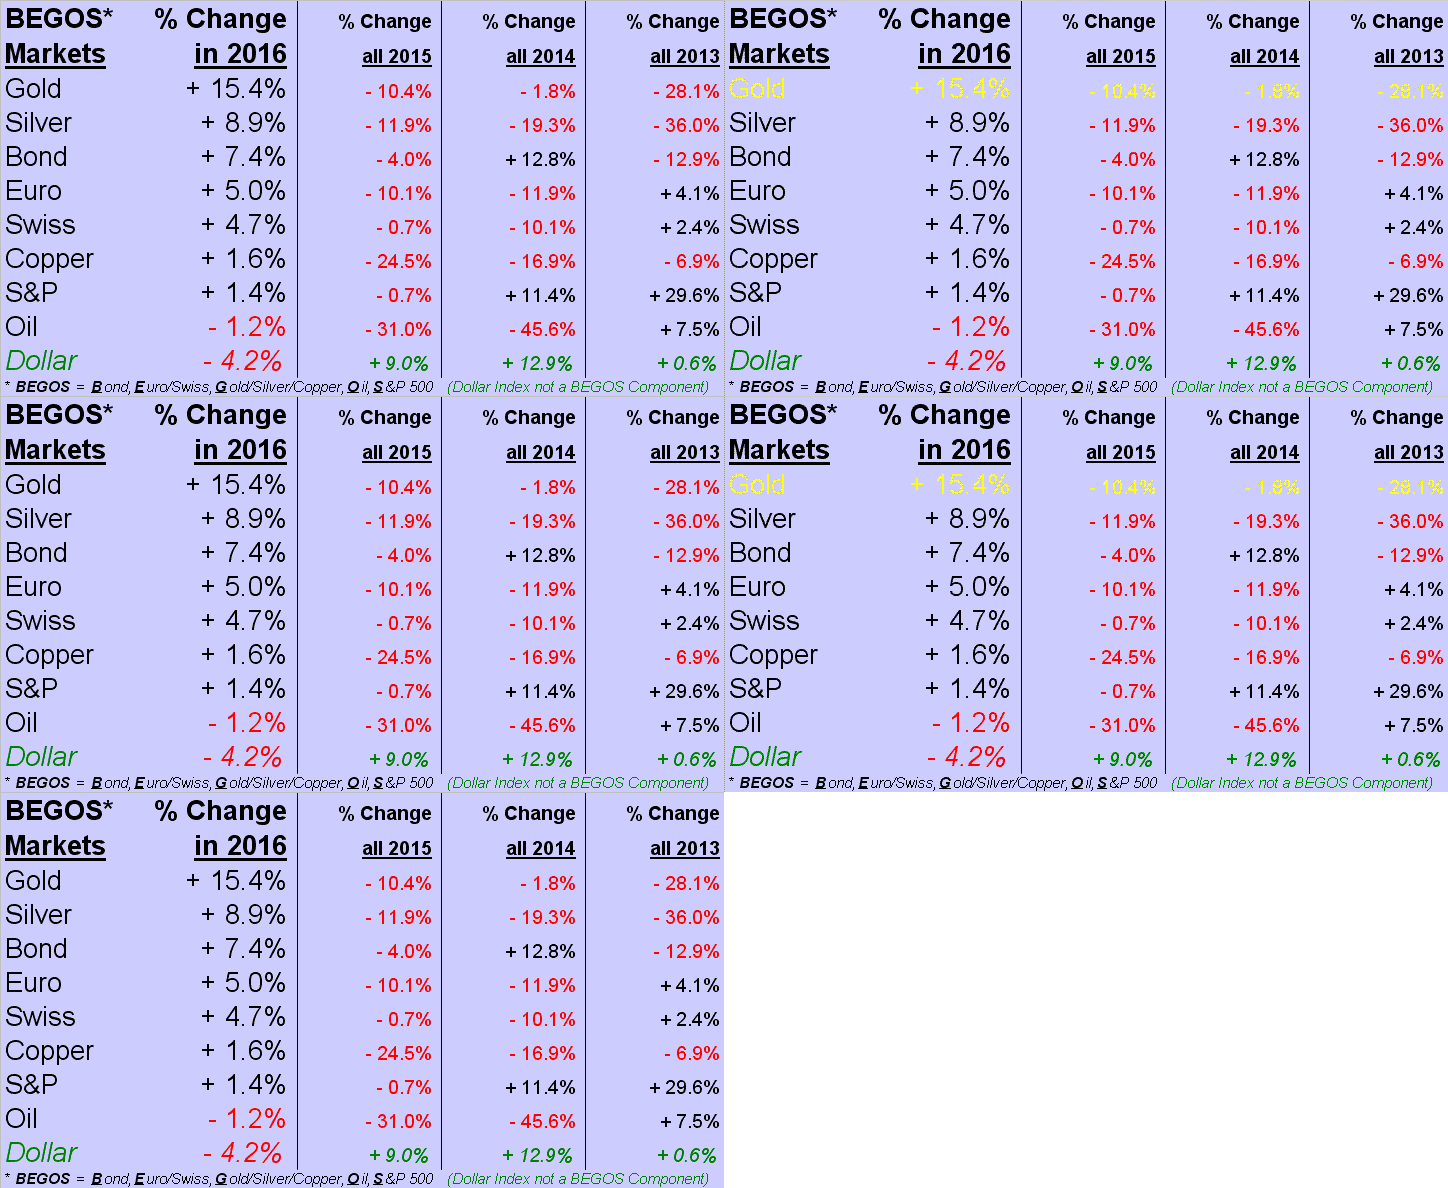
Up 15.4% year-to-date is our King Gold. Impressive, eh? And now slotted in second place ahead of the Bond is Sister Silver, whose +8.9% performance is retarded only by Cousin Copper's meager +1.6% gain. Were Silver not weighed down in her industrial metal jacket, she ought well be prancing in her precious metal pinstripes atop the standings.
Still, in spite of all the relieved excitement over the stock market, which you can see as measured by the S&P 500 is +1.4% year-to-date, Gold's grand performance apparently has 'em mystified out there. Why even CNN just ran with a piece entitled: "Investors are still betting big on gold. What do they know that you don't?" Mum's the word, folks. The longer we can keep it a secret, the greater the inevitable upside upon everybody wanting to get some Gold.
"That's nice, mmb, but it also said on the news the stock market is having a great comeback!"
Ah, Squire: back yourself from multiple spring breaks I see; (they do appear endless out there). To be sure, stocks are back in their "who let Pavlov's dogs out" mode. It matters not that earnings are only supportive of an S&P half its present level of 2073, nor that our three-month moneyflow alone values the Index instead at 1902. No. Rather, 'tis merely the slightest sense of any dovish wavering amongst Federal Open Market Committee members -- the mouths of Pavlov's mutts begin to secrete froth -- and 'tis "bark bark bark, buy on Fed, bark bark bark, buy on Fed!", all as if the FOMC members are down in the bowels of the Eccles Building stirring up a new batch of punch. And when we read stuff like "Get ready for this market to take flight thanks to tech stocks", well, you know...
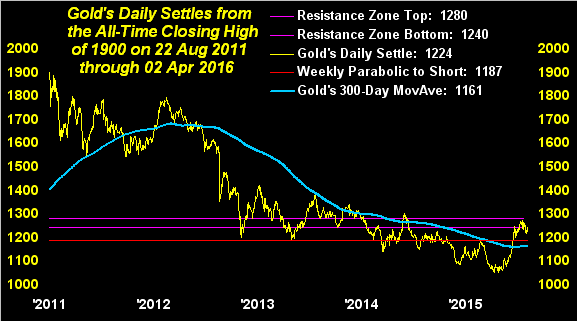
Of course, stocks will, as they always do, regress to some sensible level of revaluation, just as shall Gold catch up to currency devaluation. But with specific respect to the Fed: what deserves far more scrutiny is not its disposition as to the level of interest rates, but rather to its growing angst within, some FedWatchers going so far as to use the "R" word: Revolt! Dissent amongst ranks has reinvented many-an-entity throughout human history, and any organizational uncertainty over the Fed, which would further foster lack of credibility ahead, in turn would become for Gold quite the incentive for price to go (per our favourite technical expression) upside gonzo nutz. Why, Fed Chair Yellen's remarks this past Tuesday before the Economic Club of New York saw Gold (and everything else ex-dollar) soar $14/oz. in a mere 20 minutes: continue that rate of climb and Gold would make an new All-Time High above 1923 in a mere 16 hours!
Gonzo or otherwise, 'tis so far so good (understatement) for Gold in 2016. Yes, Gold recently ran afoul of the 1240-1280 resistance zone, yet still closed mildly higher for the week in settling yesterday (Friday) at 1224. So as we below go to the weekly bars, again note the green arrow mid-chart: it marks the 1190s level which as we'd previously noted is the "visible" area traders are eying do some more buying. And the way Gold is technically trending near-term, we wouldn't bet against a re-test of that area. But you know what they say about markets: when 'tis so obvious that a specific level ought trade ... it doesn't:
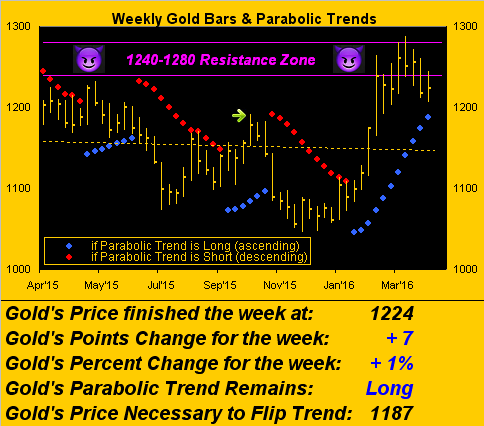
Moreover, were the 1190s not be revisited for the "Back Up The Truck" bunch, then obviously we'd know that "the bottom is in", (i.e. 1045 of last 03 December). Sad to say, however, that despite Gold's superb start to 2016, now only two ('twas three) of our four criteria are in place for determining if that low is in place. 'Tis because the 300-day moving average is once again heading, (albeit mildly) lower. Here are the criteria and their chart:
■ The weekly parabolic trend ought be Long ('tis)
■ Price ought be above the 300-day moving average ('tis)
■ The 300-day moving average itself ought be rising ('tisn't)
■ Price ought trade at least one full week clear above 1280 (hasn't)
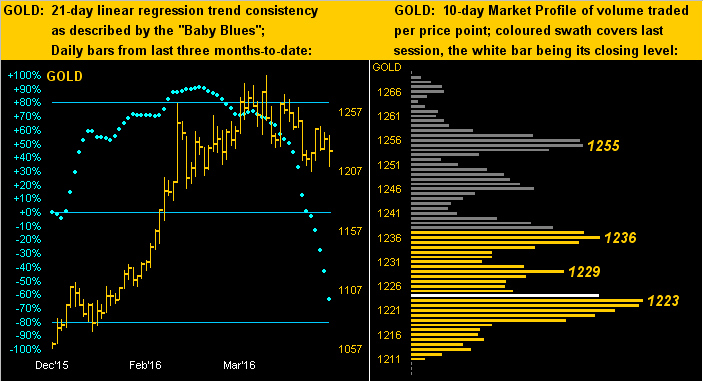
As for those near-term technicals, here next is the two-panel graphic, wherein on the left across Gold's daily bars for the past three months we've now got the "Baby Blues" -- that day-by-day measure of 21-day linear regression trend consistency -- in deep dive. But given the plunging dots, price's resilience remains stout. And if it seems to you that the 1220s have been getting a lot of action of late, Gold's 10-day Market Profile on the right confirms your notion, 1223 being the most commonly traded price over the past 10 sessions:
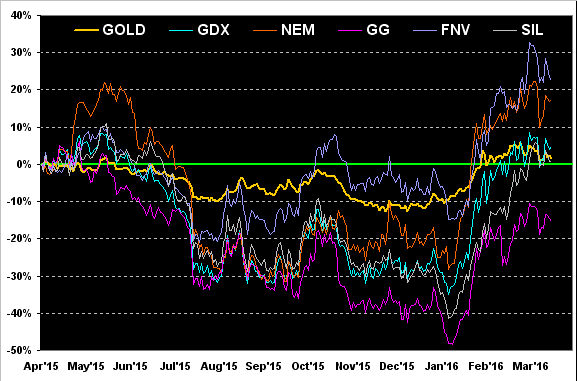
'Course with March having slipped past, 'tis once again time to go year-over-year with Gold and several of its most notable equities kin. We've again changed up the mix per the prudent guidance of an illustrious reader (thank you THR!) in bringing back Market Vectors Gold Miners (NYSE:GDX) (the prominent exchange-traded fund of the Gold miners), having in the spirit of the beginning of baseball season put HUI (the Gold Bugs Index) on waivers. Remaining in the mix are Newmont Mining Corporation (NYSE:NEM), Goldcorp Inc (NYSE:GG), Franco-Nevada Corporation (NYSE:FNV), and Global X Silver Miners (NYSE:SIL) (the popular exchange-traded fund of the Silver miners). As for 2016-to-date, Gold may be leading the BEGOS Markets +15.4%, but FNV? +33.5% ... BANG!
Meanwhile, how 'bout all that excitement on the economic front? Lending growth in the Eurozone is growing at its best pace in five years: nothing like "forced" lending to mitigate your depository's sub-zero interest rate. And actually, 'tis not all that great: The Zone's confidence in the economy fell yet again last month. Speaking of sentiment, 'tis quite the corporate worry over in Japan, the Nikkei falling some 3.6% just yesterday. Then in the Year of the Monkey, S&P on Thursday cut its rating for China's credit from stable to negative as financial and economic risks are on the increase.
So fortunately, we must be rockin' StateSide, a young-sounding Top of the Hour radio news broadcaster gleefully reporting the 216,000 "jobs" (not "payrolls") increase in March. But her tone quickly went to one of confusion, stating in her next sentence that the rate of unemployment went up, (the producer then immediately cueing the advertisement cluster). Yes, Miss, we're all confused:
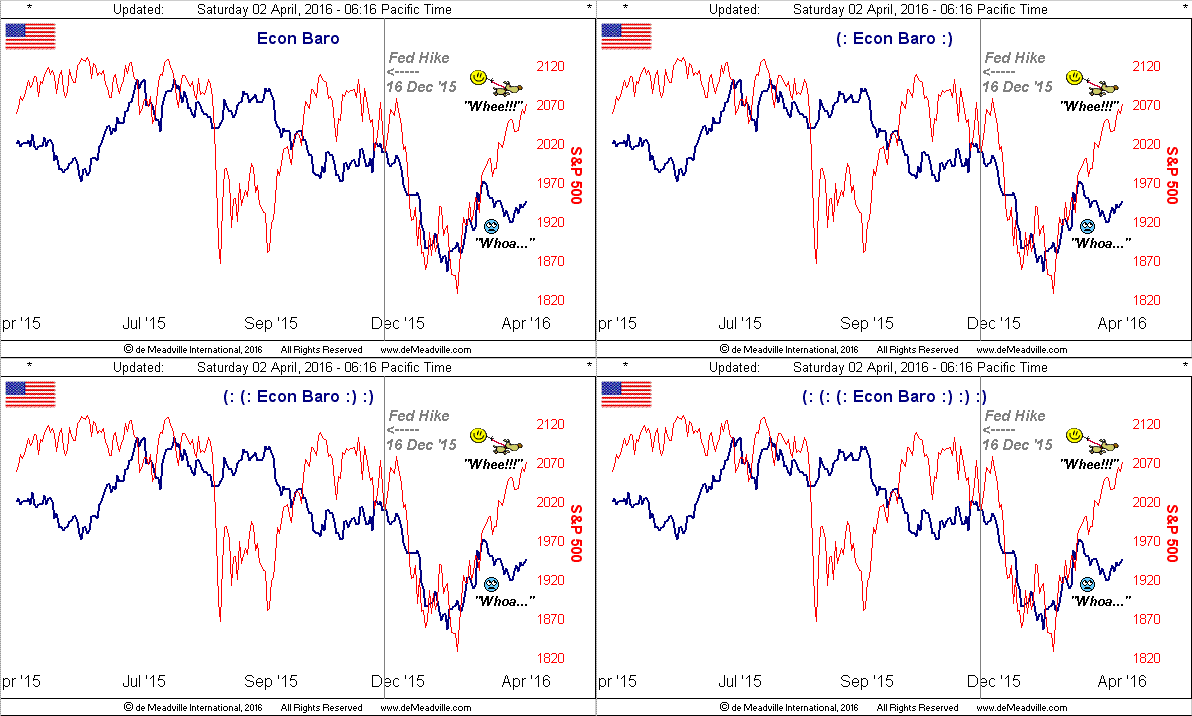
What was it about a week back how Wells Capital Management's Jim Paulsen referred to stocks as being in a "bunny market"? In our neck of the woods, bears eat bunnies for breakfast. Nuff said.
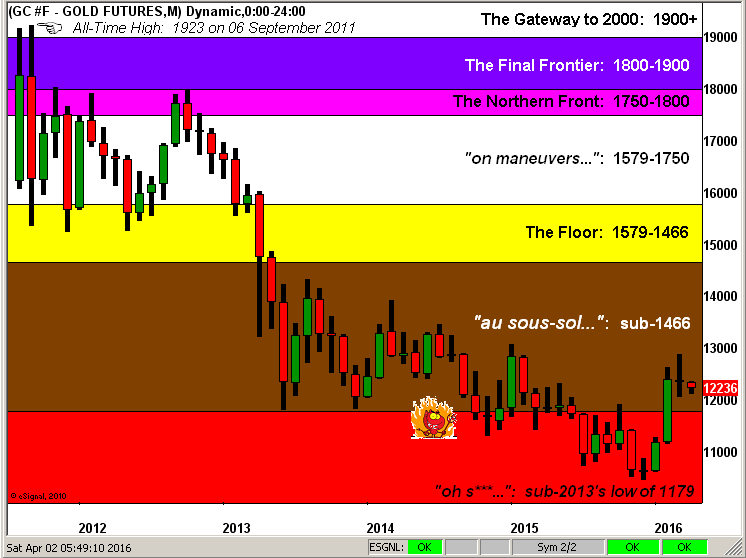
As again we slide into a new month, here's our strata-defined Gold Structure chart in monthly bars:
So in calling it a wrap for this week, 'tis no April Fools' joke this: here in the Principality of California, His Serene Highness Prince Jerry is poised to put pen to parchment in the new week in signing a $15/hr. minimum wage proclamation. From the "Old Geezer Dept.", back when the US money supply as measured by M2 was $1.76 trillion (vs. today's $12.61 trillion), with MBA in hand, I excitedly accepted a position in the Barclays Bank corporate lending unit here in San Francisco for a sparkling $27,000/yr. I was rich. But now let's do the math: the new $15/hr. minimum wage x 8 hours per day = $120/day x 252 workdays per year = $30,240/yr. To be sure, the currency debasement over those years has been nothing short of massive, but that wage, especially for the services provided, still seems like a lot of dough to me. A $30k/yr. minimum wage'll buy you two one-ounce Gold coins per month. Pretty good work if you can get it!
Wednesday brings us the FOMC's 16 March meeting minutes: "... rumble rumble rumble ... mutiny mutiny mutiny ..."