Gold and the Japanese yen turned out to the top gainers yesterday as risk sentiment worsened, pushing investors in a flight to safety. The U.S. ISM manufacturing PMI was lower at 57.2 in March, following a print of 57.7 in February, while the construction spending expanded at a pace of 0.8% on the month in March.
The Japanese yen closed the day with 0.42% gain as USD/JPY settled at 110.89. Gold prices jumped 0.25% on the day, closing at $1253.23 after initially slipping to post a session low at $1244.44. The U.S. equity markets were also in the red with the Dow Jones slipping 13 points while the S&P 500 was down 3 points.
Investors were wary especially after reports emerged about the blasts that ripped through a train traveling between two subway stations in the city of St. Petersburg, Russia killing 14 people.
Looking ahead, economic data today will include the U.S. factory orders and the UK construction PMI which is expected to remain steady at 52.5 from February.
EUR/USD intra-day analysis

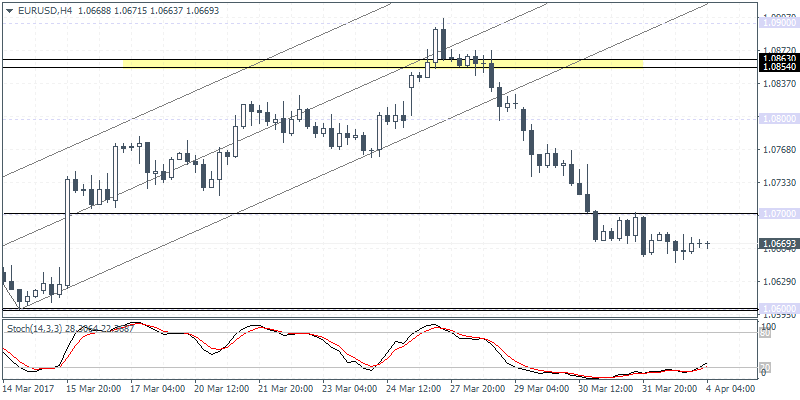
EUR/USD (1.0669) closed on a bullish note yesterday after prices fell to a 13-day low at 1.0649. This is the first bullish close after four consecutive bearish days and could signal a potential correction in the declines.
Price will need to break out above 1.0700 which is the initial resistance level, following which a retest to 1.0800 could be on the cards. On the 4-hour chart, the Stochastics readings are also oversold below 20 which supports the upside view in prices. To the downside, however, further declines could push EUR/USD towards 1.0600 support.
EUR/CAD daily analysis

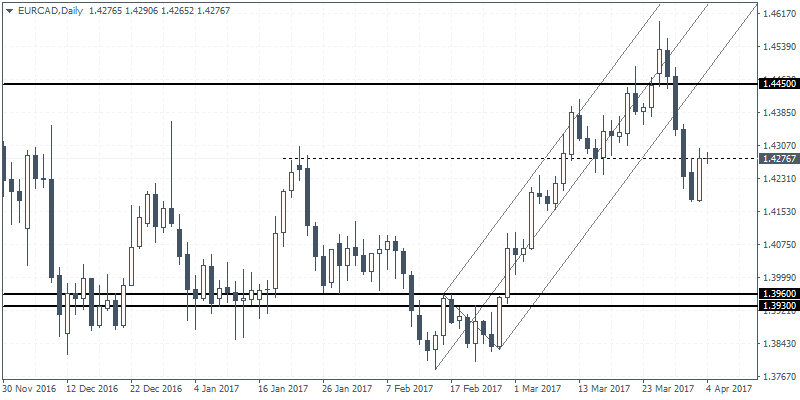
EUR/CAD (1.4276) is also looking to retrace the declines after yesterday's bullish engulfing pattern that emerged after four consecutive bearish sessions. Price action will need to break out above the initial resistance seen at 1.4278 for a continuation towards 1.4450 where a retest of the level could signal a continuation to 1.3960.
The Bank of Canada released its business outlook survey yesterday which reflected optimism on rising domestic demand after nearly two years of subdued activity. Later this week, the focus will be on the March payrolls report from Canada which could add further upside to EUR/CAD.
USD/JPY intra-day analysis

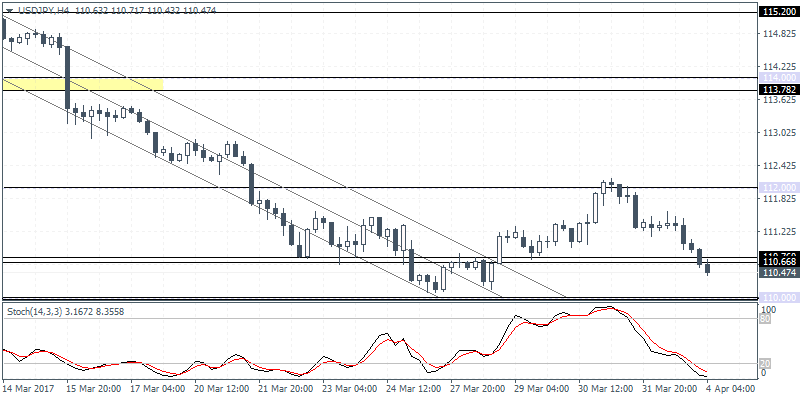
USD/JPY (101.47) slipped back towards 110.70 - 110.65 support level yesterday which represents a rest of the level that previously served as resistance. A reversal here will confirm the view as we see the hidden bullish divergence on the Stochastics which is currently printing a lower high against the higher high in price.
A reversal will confirm the upside towards the first resistance level at 112.00. However, if the U.S. dollar continues to remain weak, then we can expect to see a decline towards 110.00 which could be tested firmly.
