Welcome to the 300th consecutive weekly penning of The Gold Update. We shan't embellish it as did we the prior two centennial essays other than to express with emphasis our "Thank You!" to two of you: 1) to the Website Editors who link to and republish these missives; that's your risk, and 2) to the Readership, to whom we declared we'd stay the course either to Gold 2000, else Edition 200, and upon reaching the latter came the emails to "Keep Going!"; that's your love. Now at Edition 300, let's drive to Gold 2000.
Someone will correctly pick the bottom in Gold vis-à-vis its run down from the All-Time High of 1923 on 06 September 2011 to what at least has been the low since then, 1072 this past 24 July, (an all-in decline of -44%). 'Tis not important as to who the "someone" is, but if the "someone" who bought at 1072 so did to become net Long (rather than to simply Short cover), and stays the course, their reward shall be ample.
Regardless of 1072 being as low as Gold goes, how will we really know when the bottom is in? Time and again these past four years we've endured the fallout of many a false bottom. But to have come within 200 points of throwing out 35 years of mitigative gains against the seven-fold increase in both Federal Reserve Notes and M2 "magic money" is strongly suggestive that the final bottom of Gold's four-year fall is quite close. But again, how will we know?
Markets oft mark major bottoms with capitulative sell-offs, creating a deep "V" pattern in the track of the price. Yet, such may not characterize the bottom of this Gold run simply because 'tis hard to sell a lot of something that "nobody owns" or that with which core holders such as central banks shan't foolishly part. Therefore, Gold's ultimate low (i.e. that preceding the next new high north of 1923) may be identifiable more by price consolidation rather than by capitulation. And that is a case we can make right now. To wit:
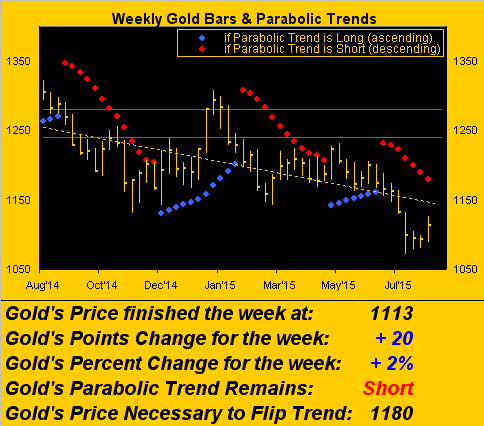
China's currency devaluation this past week of some 3% is being credited with Gold's having gotten a bid. Below we can see that as Gold's weekly bars produced their third consecutive "higher low" in posting the best weekly gain since that ending 15 May, in tur reducing the "gap" for flipping the parabolic trend to Long from 96 points a week ago now to 67 points (1113 to 1180):
But here's the important bit: lost in the kerfuffle of China's currency shuffle is the fact that Gold was already firmly on the upside, well before knowledge of the yuan's devaluing had come to the fore during Tuesday and Wednesday. Here's the entirety of the week's trade (from Sunday, 15:00 Pacific Time through Friday [yesterday], 14:15). Each price "candle" in the chart represents the trading of 10,000 Gold contracts. The vertical bar marks the awareness of China's devaluation at our Midnight (Monday into Tuesday) followed by the two green "power bars", Gold then going on to reach as high as 1126 in putting in a refreshingly buoyant week:
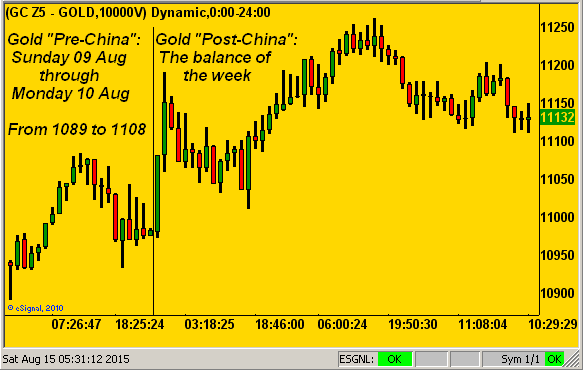
The point is: China may have aided Gold's cause, but the move was already afoot, as well it should've been. Here's why:
Recall the emphasis of last week's missive on the paranoia over Gold when 'tis actually been consolidating? Indeed as far back as two weeks ago, we saw the "Baby Blues" (our measure of linear regression trend consistency) — in spite of Gold's "panning" — already beginning to curl upward for the Precious Metals, whilst similarly bending down for the stock market. Now below from left to right are the last 21 days of trading, the "Baby Blues", and the diagonal linreg trendlines themselves for Gold, Silver and the S&P 500. And with respect to the Precious Metals, see the move from consolidation to up? Nice!
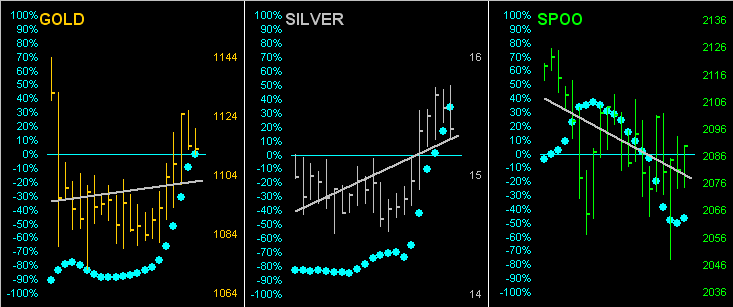
Even absent China's currency devaluation, the above graphic's panels-to-date may have turned out just as similarly so, given price's consolidation suggestive that Gold is close to "The Bottom". And this is how we'll know:
To the Shorts' chagrin, "The Bottom" will be in upon seeing price rise both swiftly and regularly over several days: 70 points here, 30 points there, then a further 50-point flare. In borrowing from the "Sara Lee promo", "Nobody doesn't like Gold", and even the most negative of its nattering nabobs know logic eventually wills out. It may have been culturally cool to "dis" Gold these last four years, but at the end of the day, the power and drive of the prior 4,996 years (give or take a millennium) shan't be thwarted much longer. Despite in vogue writings to the contrary, Gold is a safe haven, is the de facto "faux-dough" mitigant, and is the most enduring form of money in human history. Write it down.
Rather, what's forebodingly scary to us is this. On Wednesday, a locker room acquaintance looking rather disgusted said to me in a somewhat forlorn tone,"Jeeze, the market's down over 200 points!" I noted to him, given this era of complacency, how difficult 'tis to weather a 1% down day, and yet well-remember a single session some 28 years ago wherein the S&P lost over 20% of its value, as well as two multi-month 50% haircuts during 2001/2002 and 2008/2009. I said: "I'm not really worried about Gold; what does concern me is the stock market, for upon correcting from here by 50%, 'twould still be expensive by business school standards." With a sigh, he left the building.
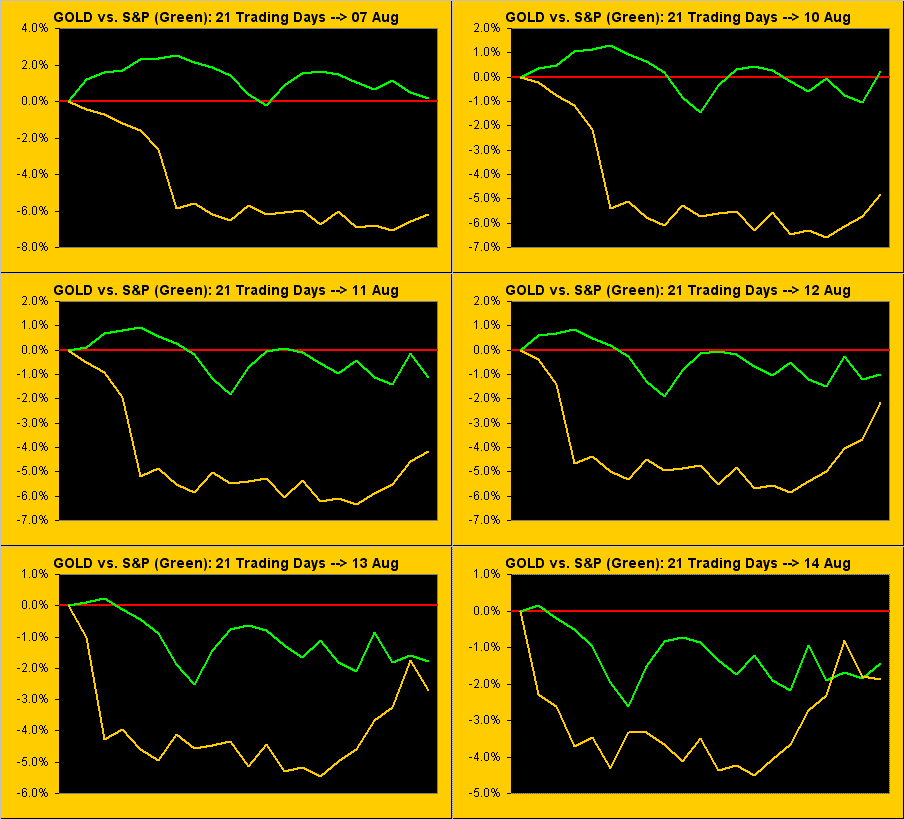
Which brings us to this next chart of Gold's 21-day percentage track compared to that of the S&P. A week ago, we noted how their entwining pas de deux had separated into a pas de gone, but to be watchful for Gold to move back up above the S&P in a pas de croix, (which for you WestPalmBeachers down there means "cross"). Here's how it animatedly unfolded from Friday a week ago (07 Aug) through this past Friday (14 Aug):
Indeed, 'tis hard to find any good news for the stock market. With, by our measuring, but one week left in Q2 Earnings Season and data collected-to-date for 2,544 companies, 50% have bettered their year-over-year Q2 bottom lines: that's the weakest improvement percentage since Q3 of 2009 (39%).
Specific to the S&P 500, its price/earnings ratio by those "business school standards" remains more than double what it "ought be", our "live" reading currently 35.0x. But maybe, just maybe, the stock market will get a break from not having its bubble break. Why? Ask oneself this: should the Fed really nick up its Funds Rate with the economy clearly in hesitation of late as shown below in the Economic Barometer? Let's see how the Federal Open Market Committee's July meeting minutes read this coming Wednesday (19 Aug):
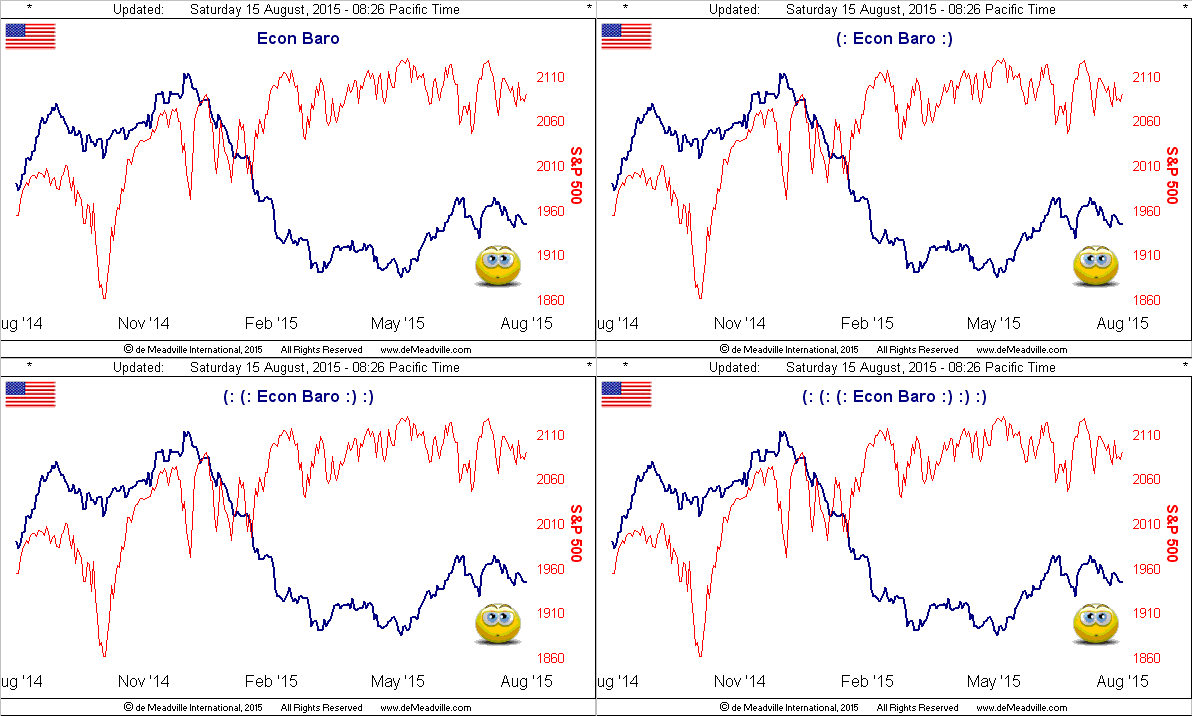
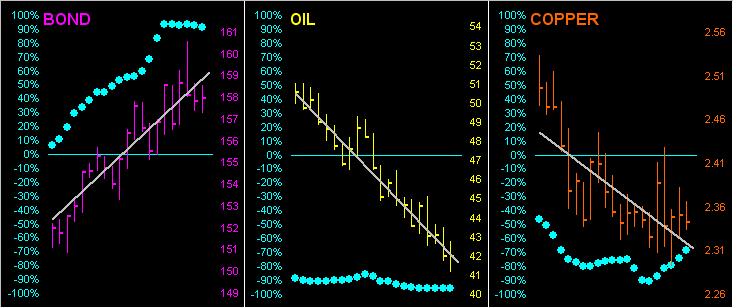
Moreover, can a StateSide economy in which corporate results are materially dependent upon foreign revenues be insulated from China's rising distress over its own economy? Going 'round the world the other way, we read that the EuroZone economic recovery likely stalled in Q2 as GDP missed expectations inclusive of heavyweights Germany, France, and Italy. And our 21-day tracks below from left-to-right of the rising Bond price, plus falling Oil and Copper prices are hardly anticipative of economic expansion:
What was it that the Immortal Bard's witches were going on about? "Double, double toil and trouble; Fire burn, and market bubble..."?
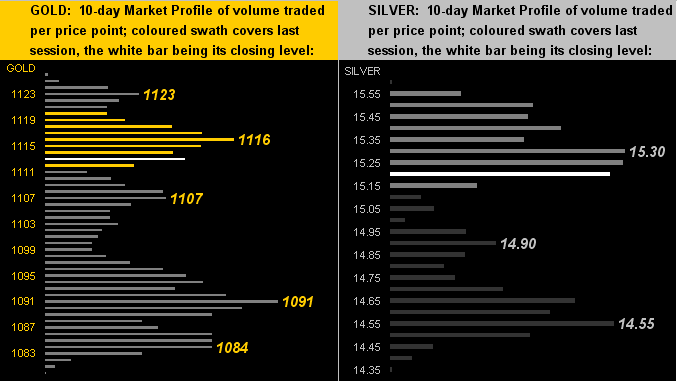
Gold has an ever so long upside road to go before "bubble" can even be brought into its script, for by our Gold Scoreboard reading alone of 2531, Gold presently at 1113 is "undervalued" by some 56%. But 'tis good to see the Precious Metals making headway within their 10-day Market Profiles as we next see here, with Gold on the left and Sister Silver on the right:
As for how 'tis all stacking up, here we've the present state of:
The Gold Stack
- Gold's Value per Dollar Debasement, (per our opening "Scoreboard"): 2531
- Gold’s All-Time High: 1923 (06 September 2011)
- The Gateway to 2000: 1900+
- The Final Frontier: 1800-1900
- The Northern Front: 1750-1800
- On Maneuvers: 1579-1750
- The Floor: 1466-1579
- Le Sous-sol: Sub-1466
- Base Camp: 1377
- Year-to-Date High: 1307
- Neverland: The Whiny 1290s
- Resistance Band: 1240-1280
- The 300-day Moving Average: 1217
- The Weekly Parabolic Price to flip Long: 1180
- 10-Session directional range: up to 1126 (from 1080) = +46 points or +4%
- Trading Resistance: 1116 / 1123
- Gold Currently: 1113, (weighted-average trading range per day: 17 points)
- Trading Support: 1107 / 1091 / 1084
- 10-Session “volume-weighted” average price magnet: 1101
- Year-to-Date Low: 1072
Further for the new week, we've the aforementioned FOMC minutes come Wednesday. But amongst the data mix come Thursday is a favourite lagging indicator -- Leading Indicators -- and consensus shows them having slowed from 0.6% in June to 0.2% for July. The Econ Baro doesn't lie.
So there we go folks, and to use a little football lingo, that's 300 Editions down and Gold 2000 to go. I like the sound of that. As for the keys to Gold's game, there's but one: watch for swiftly rising prices, by which we'll know the bottom is in -- and then "SCORE!"