Before the Brexit vote on Thursday, June 23rd, opponents of the UK leaving the EU warned of the doom-and-gloom consequences for Great Britain if this took place. While there were indeed some immediate doom-and-gloom consequences, they were by no means in the UK.
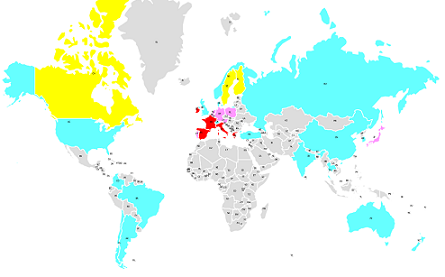
Just like a hurricane blows down the weakest trees with the most internal rot, political events will most strongly impact stock markets with the weakest underpinnings. A world map of major stock returns the day after the Brexit vote is very instructive in this matter.
Of course, it wasn’t just stocks that were impacted by the Brexit vote, nor will the impact last just a single day. Gold skyrocketed on the news as would be predictable because of its safe haven status during a political crisis. It was up $59, or 4.9%, an ounce on the day following the vote.
Oil, on the other hand, was down by an almost equal amount, with WTI crude falling $2.52 a barrel or 5.1%. The U.S. dollar and Japanese yen were up by 2.1% and 3.6% respectively. These were the two safe haven currencies during the Credit Crisis in 2008-09 and obviously still have that status.
The British pound was down 8.4% and the euro was down 2.7%. Ironically, the Japanese took extraordinary measures to drive down the value of the yen in 2014-15 in order to stimulate their economy. Britain got this advantage overnight.
The chart below shows how stock markets globally reacted to Brexit. The biggest one-day drops, more than 8% are in deep red. The next steepest drops, more than 4% up to 8% are in pink. Drops from above 1% up to 4% are in light blue. Drops of less than 1% to gains of 1% are in yellow (yes, a couple of markets actually went up despite the wave of selling that swept across bourses throughout the world).
Map of Stock Market Performance on Friday, June 24, 2016

It immediately becomes apparent from looking at this map that the stock markets with the biggest drops after the Brexit vote were in the EU, but this didn’t include the UK. The UK wasn’t even in the second tier of worst performing markets. The deep red countries are France and a group of EU countries referred to as the PIIGS (Portugal, Italy, Ireland, Greece and Spain) during the first two Greek bailouts. Portugal, actually didn’t quite make the cutoff since its stock market dropped only 7.0%.
These countries were considered to have the worst fiscal picture and to be themselves potential candidates for future bailouts like the three that have been necessary to keep Greece afloat. Greece was down 13.7%, Italy was down 12.5%, Spain was down 12.4%, Ireland was down 9.7% and France was down 8.0%. In comparison, the FTSE 100 in the UK was down 3.2%, less than the 3.6% drop in the S&P 500 in the U.S.
Most of the poor performers in the second tier pink countries are also members of the EU, with the exception of Japan. The Nikkei in Japan fell 7.9%, but not as a direct result of Brexit. Stock prices in Japan move in the opposite direction of the yen. Financial fallout from Brexit caused the yen to rally strongly and this in turn caused stocks in Japan to sell off. In Europe, Austrian stocks were down 6.9%, the German DAX30 was down 6.8%, Poland was down 6.5%, Belgium was down 6.4%, and Holland was down 5.7%.
The best performing stock markets in Europe (and the world in general) were in Scandinavia. Sweden and Finland were up a fraction of a percent. Sweden has its own currency, while Finland uses the euro. The Norwegian market was down 4.0%, but it tends to trade with oil and similar to Japan, stocks there were indirectly impacted by the Brexit vote. Norway is not part of the EU.
Fallout from the Brexit vote is likely to go on for weeks or even months. If you are a trader, this is a golden opportunity because a great deal of volatility is likely to take place for a while.
If you want to buy for the short term, there could be some good quick trades within a few days. If you want to position trade (a few weeks to a few months), you should wait for some sign that things have settled down, like a major announcement from a central bank or the authorities from the UK and EU.
Possible ETFs that can be used to trade or invest with are: UK (NYSE:EWU), France (NYSE:EWP), Germany (NYSE:EWG), Italy (NYSE:EWI), Spain (NYSE:EWP), Austria (NYSE:EWO), Sweden (NYSE:EWD), Netherlands (NYSE:EWN), Denmark (NYSE:EDEN), Ireland (NYSE:EIRL), Japan (NYSE:EWJ), the British pound (Guggenheim CurrencyShares British Pound Sterling (NYSE:FXB)), the euro (NYSE:FXE), gold (NYSE:GLD), oil (NYSE:USO), and the U.S. (NYSE:SPY).
Daryl Montgomery is the organizer of the New York Investing meetup, the largest group of its kind in the world. The group provides education and information for the average investor that can’t be found anywhere else.
