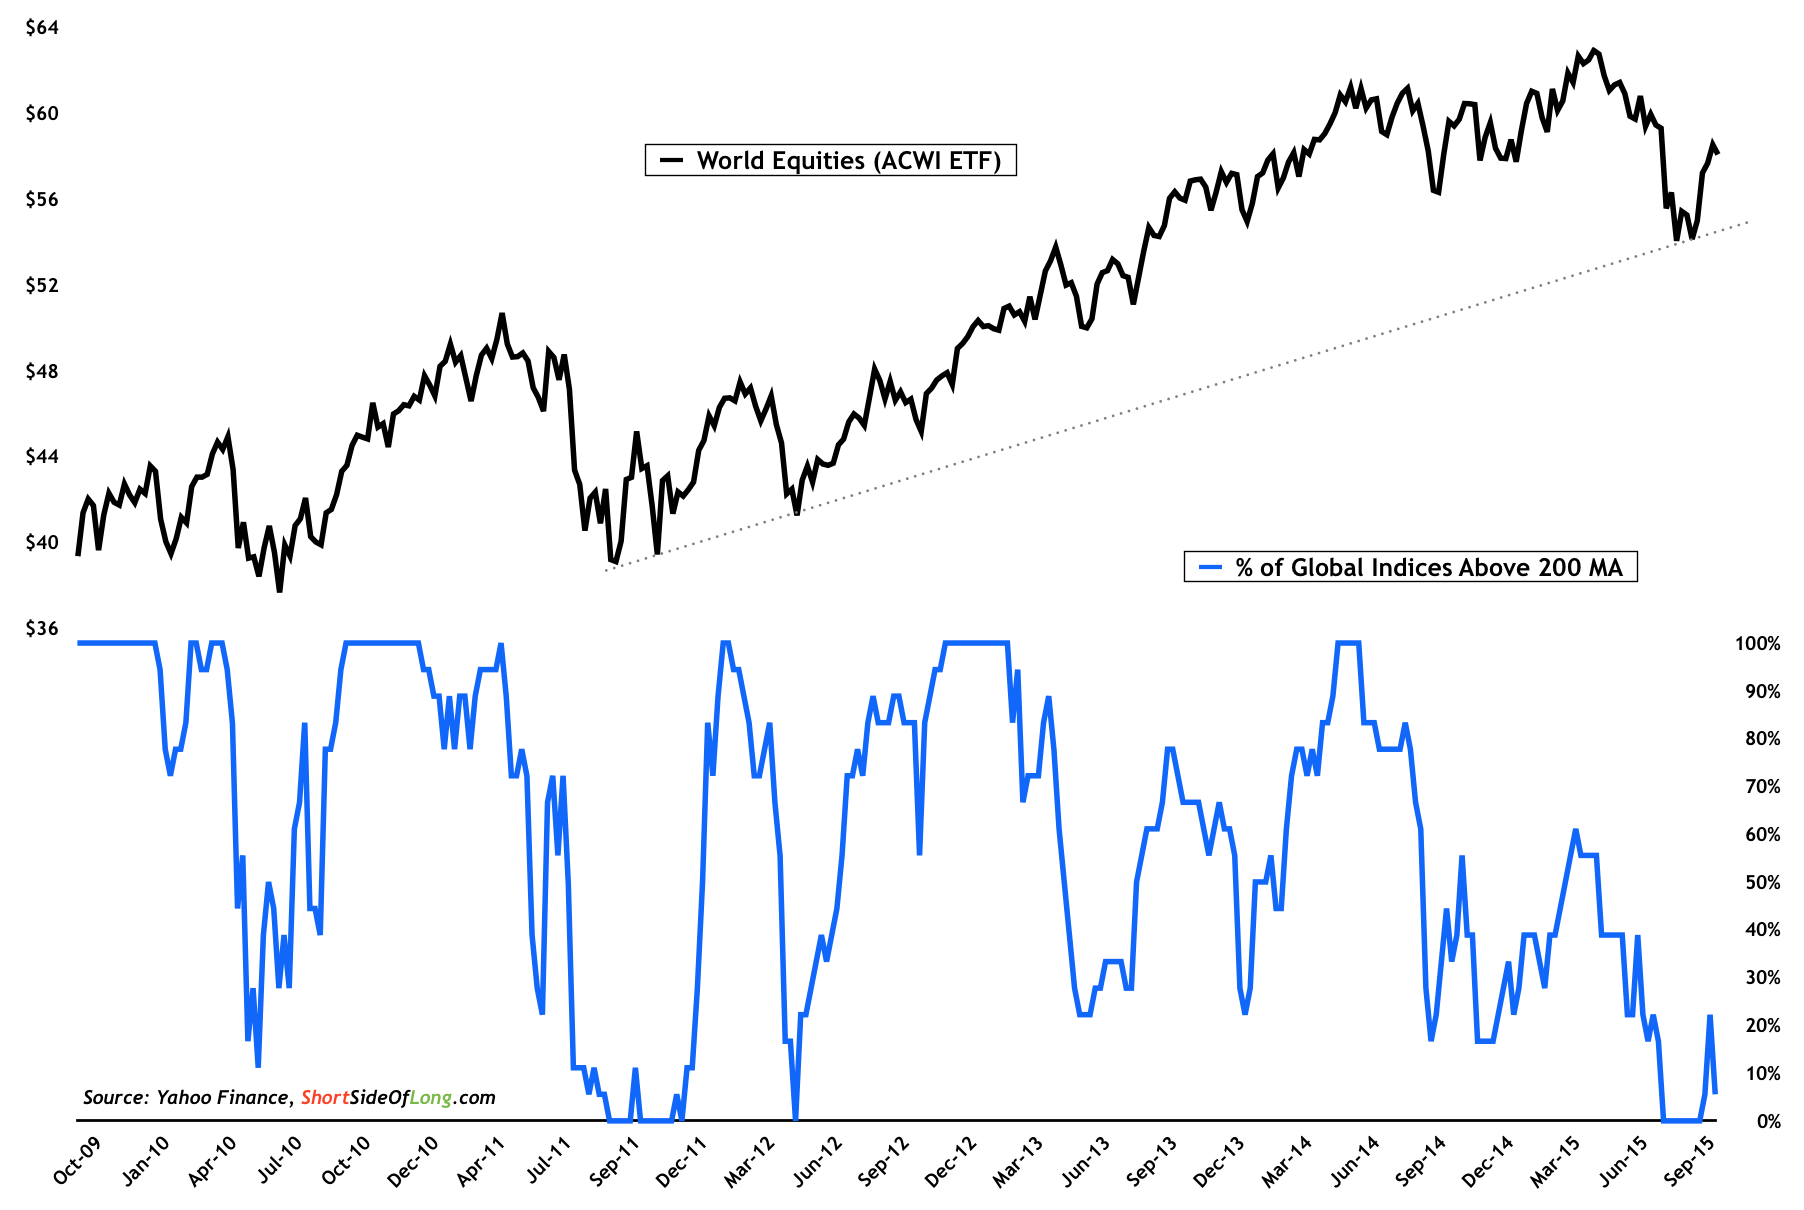
Less than 10% of all major global indices are above their 200 day MA
 Source: Short Side of Long
Despite the fact that the S&P 500 and the NASDAQ 100 are nearing their all-time record highs, globally equity indices are not performing as well. The chart above shows the MSCI All-Country World Equity Index with our breadth indicator, which tracks how many of the most important global indices are trading above their respective 200 day moving averages.
This information offers us at least two major clues. First, how many global indices are in an uptrend versus how many are in a downtrend. Breadth readings are very important during bull markets, as the strongest advances occur when just about every stock or index is participating. Second, breadth indicators can also be used as oversold and overbought readings. It should be very clear to readers that buying opportunities occur when the percentage of indices trading above their respective 200 day MAs was at single digit levels or even better, at zero.
We saw extremely oversold breadth during the May 2010 Flash Crash, October 2011 EU Debt Crisis, May 2012 EU Debt Crisis 2.0 with Draghi’s “Whatever Speech” and the recent episode of September 2015 Emerging Markets Crisis.
