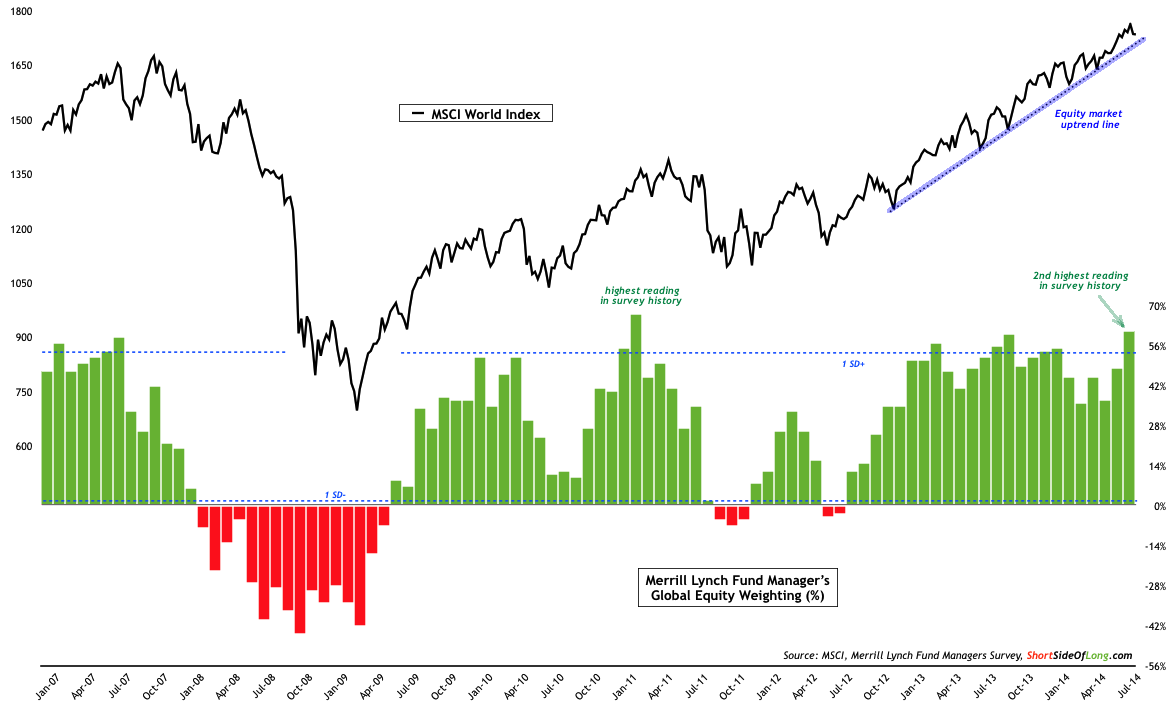
Chart 1: According to Merrill Lynch, funds are “all-in” chasing equities!

The chart above was first posted on 18th of July, in a post titled “Fund Managers All In…” and was later re-posted in the sentiment summary report for the month of July. It was one of many adequate warning signals put forward on this blog, that a potential correction was brewing in the global equity space. Truth be told, the correction has been overdue, as the current market rally has gone almost 90 weeks without touching its 200 day moving average and even longer without a 10% correction.
Furthermore, various indicators have been signalling possible trouble ahead well before selling started last week. Small cap indices such as Russell 2000 have been under-performing for a long time now, which usually signals tightening of liquidity. Junk bonds and European stocks have been falling since middle of June as the European banking sector seems to be experiencing trouble… once again (funny how problems always come back when you don’t fix them).
Various US equity breadth indicators have been warning of bearish divergence for quite some time, while the volatility index (VIX) was also creeping up for weeks already. While sentiment surveys didn’t signal extreme bullishness, percentage of bears was so low and Skew Index so high – that the word complacency was underestimating the situation. Finally, stocks find themselves in a bad seasonal period.
And now we have some selling, so let us look at how global indices are reacting…
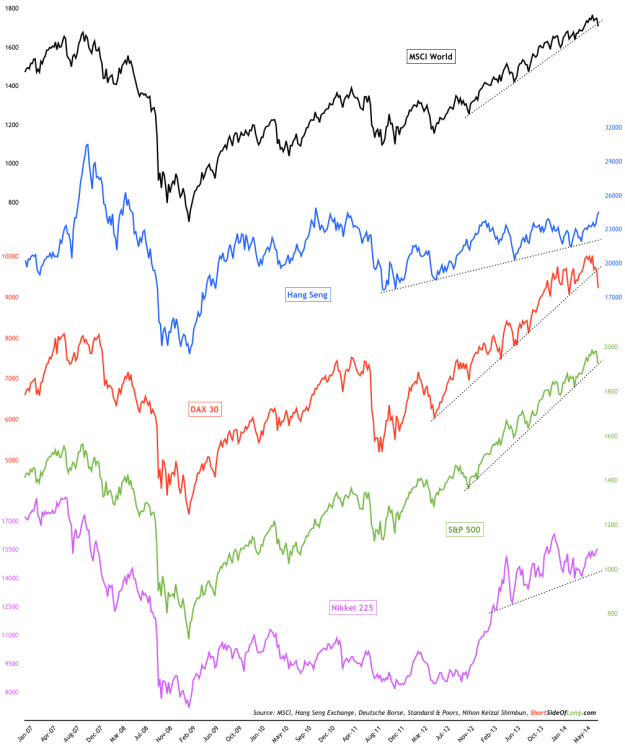
Chart 2: Global indices are currently not as correlated as one might think
The chart above shows four counter-parts of the MSCI World Index. Representing Asia we have Hong Kong’s Hang Seng Index and Japan’s Nikkei 225, representing Europe we have the German DAX 30 and finally everyone’s darling favourite… S&P 500. Here are a few observations, but I am sure you can come up with many more:
- MSCI World (LONDON:MXWO) Index is possibly close to breaking down from its uptrend line
- Hang Seng Index is has broken out to a 3 year high over the last 2 weeks
- DAX 30 has broken down from its uptrend line in a dramatic fashion this week
- S&P 500 is barley hanging on to its uptrend line by the fingernails
- Nikkei 225 has been in a sideways consolidation for quite sometime now
As already discussed couple of days ago, Asian indices have been outperforming MSCI World, S&P 500 and DAX 30. Whether this outperformance continues with more upside or just less downside, remains to be seen!

