📈 69% of S&P 500 stocks beating the index - a historic record! Pick the best ones with AI.See top stocks

Germany 30 And S&P 500 Analysis: February 05, 2018

Published 02/05/2018, 08:07 AM
Updated 03/21/2024, 07:45 AM
US500
-
DE40
-

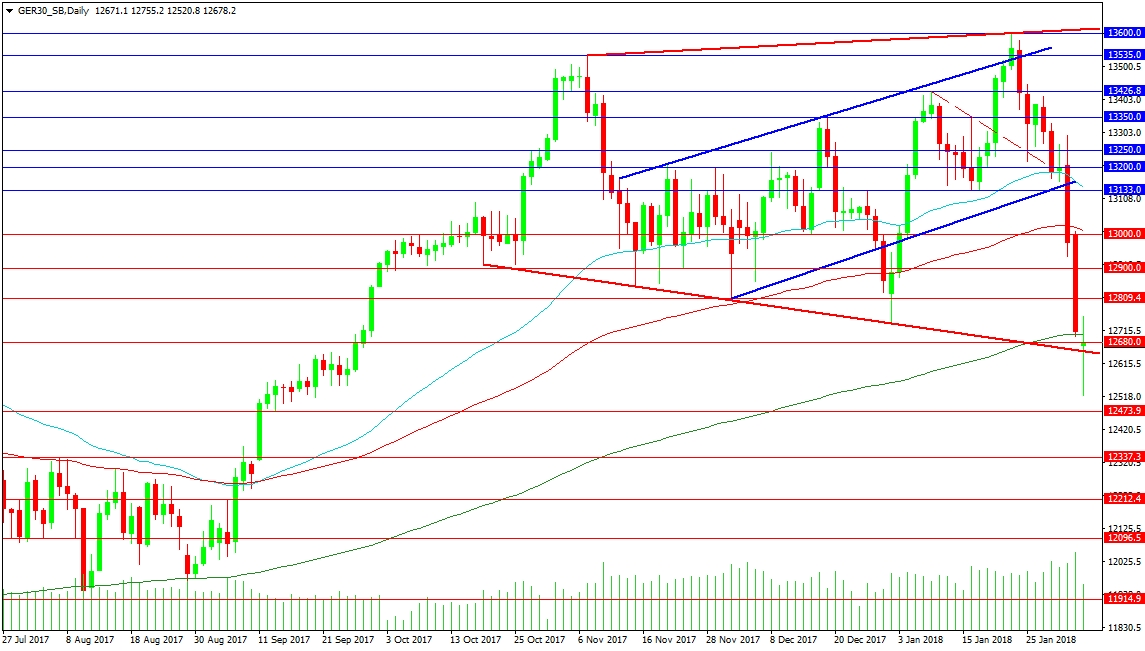
The German index has been forming a broadening pattern over the last few months. The bottom of this pattern has been tested, with the price holding above the trend line at present despite a move below overnight. The 200-Day Moving Average is located just above the price at 12700.00. Further resistance is at 12809.40 and 12900.00. The 13000.00 area can become firmer over the coming hours as the 100-Hour MA drops close to that level. The 50-Day is at 13141.10 just below the Blue bear flag bottom that broke on Thursday.

Support below the current price level is still the bottom of the pattern at 12650.00. A close below this level on an hourly time frame would suggest the bulls will have to work harder to recover the price back higher. There is light support down to 12551.4, with firmer support at 12473.9 and 12337.3. A further loss of 12000.00 could be too much for Bulls, and an increased pace of losses could occur to 11600.00.

GER30 Daily Chart

S&P 500

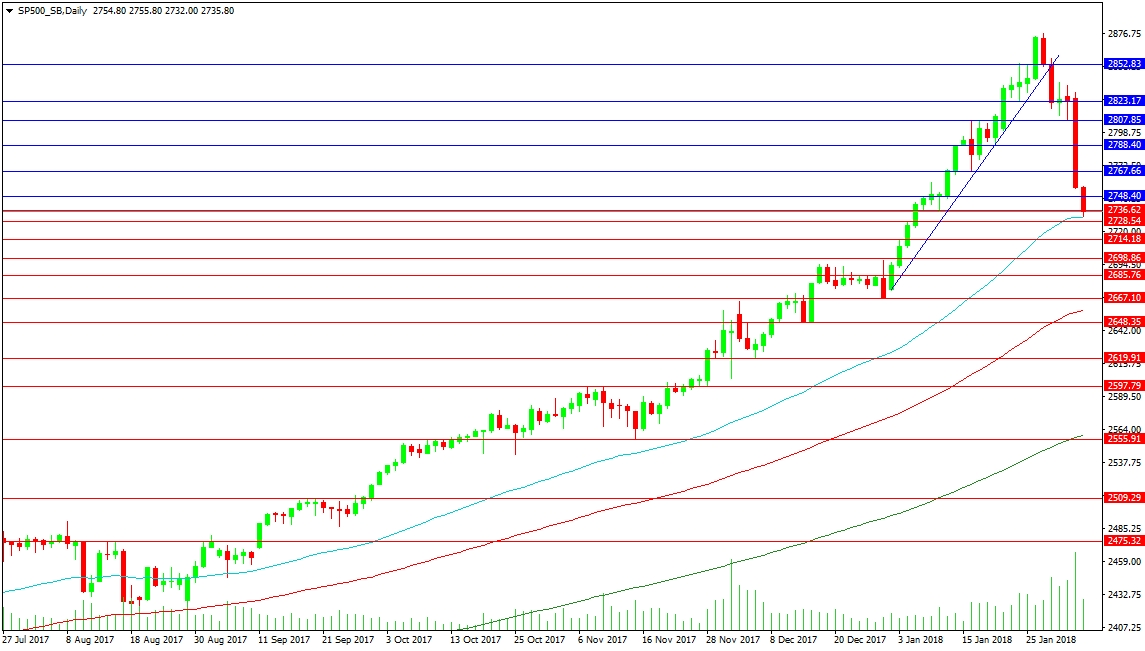
The US Index had its most bearish day on Friday since the Brexit day decision. Only the US presidential Election Day had a bigger range of late. Today, it has broken down to the 50-Day Moving Average at 2731.92, where it has recovered marginally. US traders will see a price under Friday’s close at 2755.00 as a gap lower when the market opens proper at 14:30 GMT. Only if very bearish conditions prevail will there be no attempt to close the gap. What happens at the gap close will dictate whether the market rallies or falls further.

Support at the 50-Day can be seen as a buying opportunity for buy the dip traders. Should this fail to hold the price, the next serious support is around 2700.00, followed by 2667.10 and the 100-Day MA at 2658.00. A loss of these supports targets the 2600.00 area and the 200-Day MA at 2559.00. A break above Friday’s low can see resistance tested at 2767.66 and 2788.40. Resistance around 2800.00 can extend up to 2807.23 and it may take repeated attempts to break higher above this zone in order to reach the old highs.

US500 Daily Chart

Latest comments

Loading next article…
Risk Disclosure: Trading in financial instruments and/or cryptocurrencies involves high risks including the risk of losing some, or all, of your investment amount, and may not be suitable for all investors. Prices of cryptocurrencies are extremely volatile and may be affected by external factors such as financial, regulatory or political events. Trading on margin increases the financial risks.
Before deciding to trade in financial instrument or cryptocurrencies you should be fully informed of the risks and costs associated with trading the financial markets, carefully consider your investment objectives, level of experience, and risk appetite, and seek professional advice where needed.
Fusion Media would like to remind you that the data contained in this website is not necessarily real-time nor accurate. The data and prices on the website are not necessarily provided by any market or exchange, but may be provided by market makers, and so prices may not be accurate and may differ from the actual price at any given market, meaning prices are indicative and not appropriate for trading purposes. Fusion Media and any provider of the data contained in this website will not accept liability for any loss or damage as a result of your trading, or your reliance on the information contained within this website.
It is prohibited to use, store, reproduce, display, modify, transmit or distribute the data contained in this website without the explicit prior written permission of Fusion Media and/or the data provider. All intellectual property rights are reserved by the providers and/or the exchange providing the data contained in this website.
Fusion Media may be compensated by the advertisers that appear on the website, based on your interaction with the advertisements or advertisers.
© 2007-2024 - Fusion Media Limited. All Rights Reserved.