⭐ Start off 2025 with a powerful boost to your portfolio: January’s freshest AI-picked stocksUnlock stocks

General Examination: ETFs

Published 04/03/2017, 12:58 AM
Updated 07/09/2023, 06:31 AM
XAU/USD
-
GC
-
CL
-
DJT
-
DJA
-
DJUSIN
-
DJUSUT
-
HUI
-
VIX
-
ERY
-
JDST
-
GPR
-

It seems like a very quiet weekend here on Slope – – maybe people are just exhausted from a brutal Q1 – – so I thought I’d just thumb through a few ETFs with you and share some thoughts.

First up is the Dow Jones Composite, which is an amalgamate of the Industrials, Utilities, and Transportation indexes. We’ve got a small topping pattern on this, and last week's strength simply brought it to the underbelly of resistance. What I’d expect at this point is continuation of weakness, with the big test being that green tinted area below.
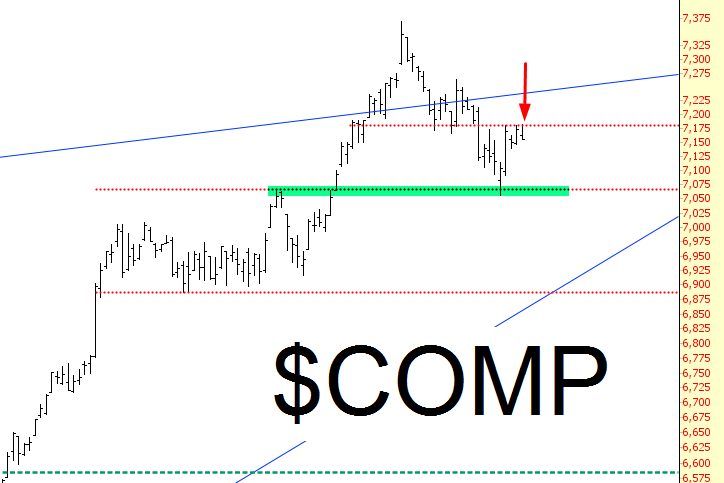
COMP Chart

A quite important chart to me is the gold bugs index, which came tantalizingly close to breaking down on Friday morning but failed to do so. My long JDST (NYSE:JDST) position really needs $HUI to break below the red support line I’ve drawn. If we push above last week’s high at about $205, forget it.
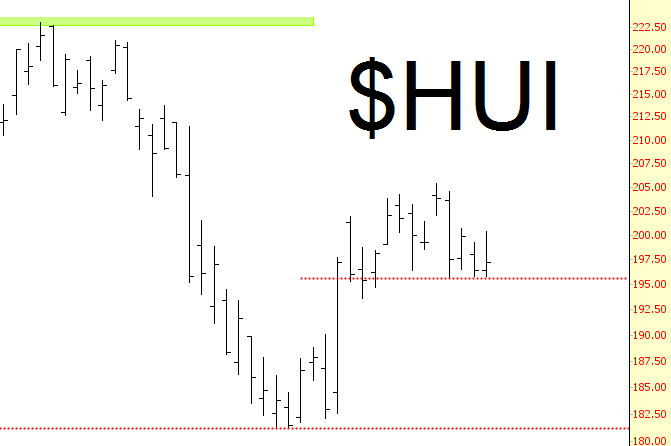
HUI Chart

Not surprisingly, equities are an upside-down version of what precious metals are doing. You can see a pattern quite similar to $COMP in the Dow Industrial 30 chart below, and we need to stay beneath the green tint to retain any hope for the bears. My dream scenario, of course, would be for gold miners AND equities to fall, but I’m not sure if that’s going to happen.
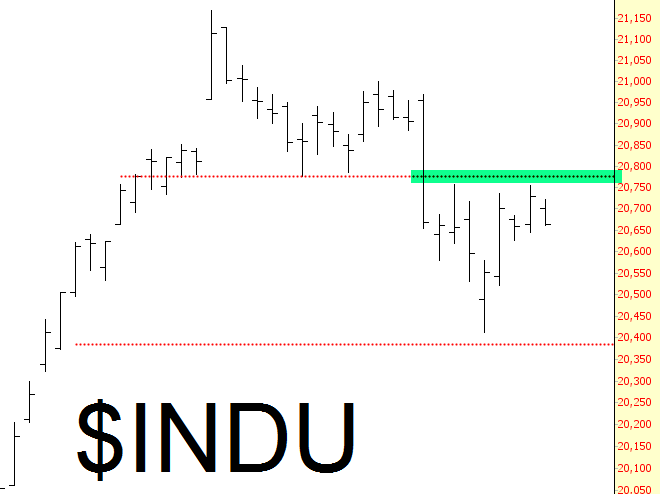
INDU Chart

For more perspective, let’s take a step back to view the small caps. The Russell has been trapped in a range for months now, hardly moving since Thanksgiving. It’s relatively volatile, certainly, but there’s neither an uptrend nor a downtrend. We are, however, in the lower half of its channel, and my expectation is for it to challenge the lower bound of that same channel.
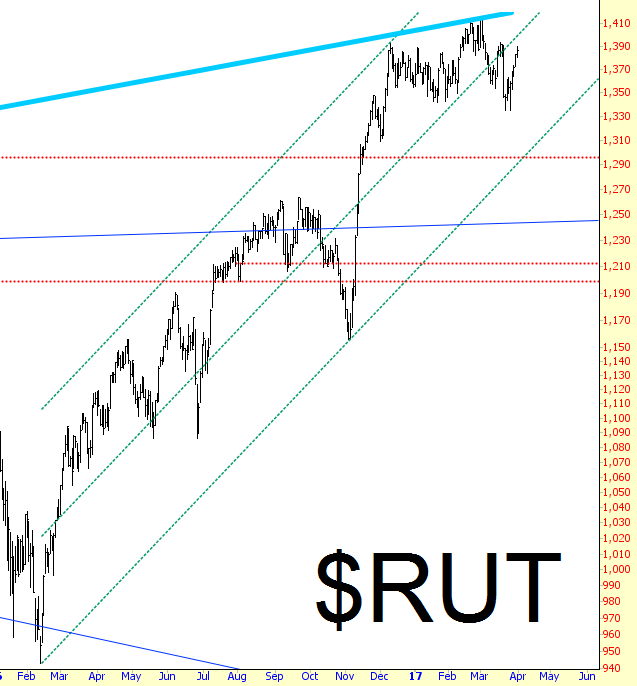
RUT Chart

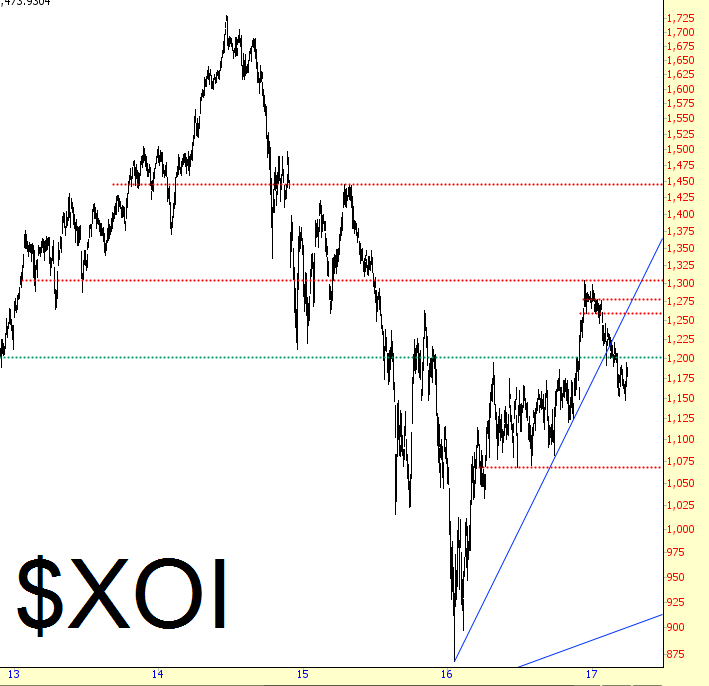
Besides gold, the other commodity I watch closely is crude oil. The oil and gas index, shown below, has been in its own private bear market for years now. My view is that we’ve entered a new leg down, and as long as we stay beneath that 1200 level, the odds are that we’ll simply keep hammering our way lower. I am long ERY (NYSE:ERY) to benefit from this.
XOI Chart

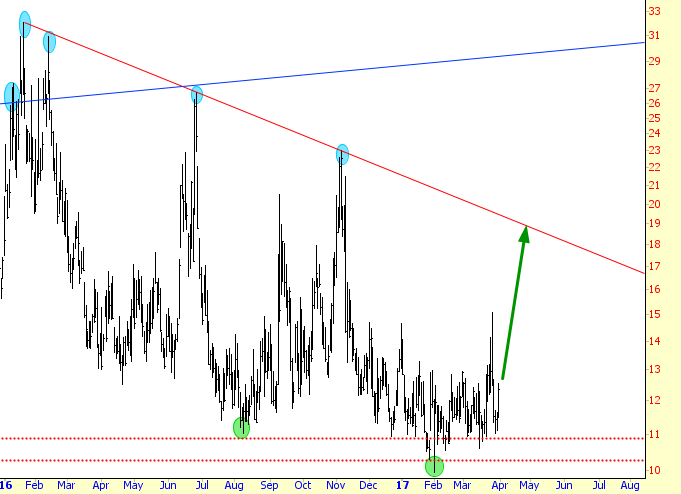
Lastly, my conviction about the VIX remains the same: until such time as we get a ‘surge’ to that trendline (and we’re sure due for one), I’m going to maintain a heavy short portfolio.
VIX Chart

Latest comments

Loading next article…
Risk Disclosure: Trading in financial instruments and/or cryptocurrencies involves high risks including the risk of losing some, or all, of your investment amount, and may not be suitable for all investors. Prices of cryptocurrencies are extremely volatile and may be affected by external factors such as financial, regulatory or political events. Trading on margin increases the financial risks.
Before deciding to trade in financial instrument or cryptocurrencies you should be fully informed of the risks and costs associated with trading the financial markets, carefully consider your investment objectives, level of experience, and risk appetite, and seek professional advice where needed.
Fusion Media would like to remind you that the data contained in this website is not necessarily real-time nor accurate. The data and prices on the website are not necessarily provided by any market or exchange, but may be provided by market makers, and so prices may not be accurate and may differ from the actual price at any given market, meaning prices are indicative and not appropriate for trading purposes. Fusion Media and any provider of the data contained in this website will not accept liability for any loss or damage as a result of your trading, or your reliance on the information contained within this website.
It is prohibited to use, store, reproduce, display, modify, transmit or distribute the data contained in this website without the explicit prior written permission of Fusion Media and/or the data provider. All intellectual property rights are reserved by the providers and/or the exchange providing the data contained in this website.
Fusion Media may be compensated by the advertisers that appear on the website, based on your interaction with the advertisements or advertisers.
© 2007-2025 - Fusion Media Limited. All Rights Reserved.