Upcoming US Events for Today:- Quadruple Witching Day
Upcoming International Events for Today:
- German PPI for May will be released at 2:00am EST. The market expects a year-over-year decline of 0.7% versus a decline of 0.9% previous.
- Canadian CPI for May will be released at 8:30am EST. The market expects a year-over-year increase of 2.0%, consistent with the previous report.
- Canadian Retail Sales for April will be released at 8:30am EST. The market expects a month-over-month increase of 0.6% versus a decline of 0.1% previous.
- European Union Flash Consumer Confidence for June will be released at 10:00am EST. The market expects –6.5 versus –7.1 previous.
The Markets
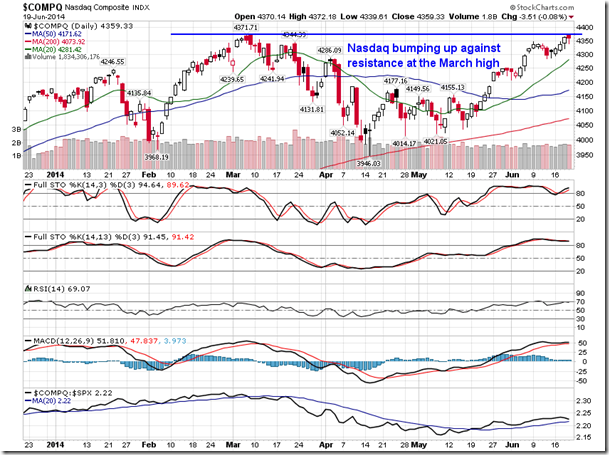
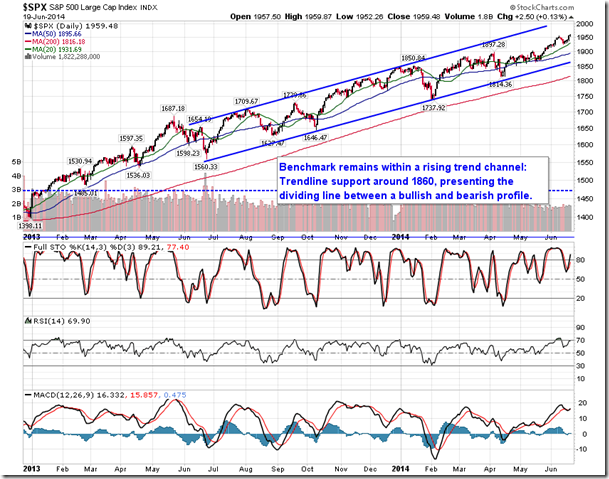
Stocks finished slightly higher on Thursday as investors continued to digest the dovish comments from Fed Chair Yellen following yesterday’s FOMC meeting. Gains continued to be led by defensive sectors as Utility and Consumer Staple stocks topped the leaderboard for a second day. The S&P 500 Index closed at a new all-time high, while the NASDAQ Composite bounced off of resistance presented by the March high, ending the day slightly lower. Today is Quadruple Witching Day, the expiration date of stock index futures, stock index options, stock options, and single stock futures. Trading volumes usually increase on these quarterly expiration dates. Stock market tendencies for the day itself are rather neutral with the S&P 500 averaging a loss of 0.06% over the past 50 years. The benchmark has finished higher in 58% of June expiration dates. The more consistent tendency occurs during the Monday that follows, often known as Witches Hangover Day. The S&P 500 Index averaged a loss of 0.21% during the following Monday with losses recorded in 60% of sessions over the past 50 years. With major equity benchmarks hovering around overbought levels, a retracement of some sort looks increasingly probable.
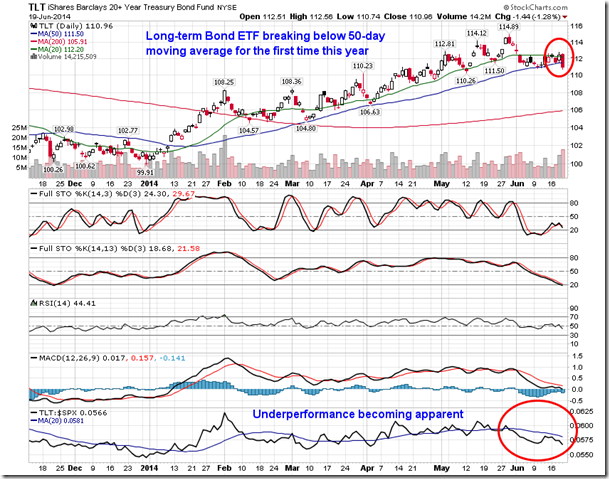
After a strong start to the year, bonds are showing initial signs of unwinding. The 20+ Year Treasury Bond Fund (ARCA:TLT) charted a bearish encompassing candle, with the trading range between the open and close exceeding that of the previous day. The bond ETF now trades below its 50-day moving average for the first time this year. Underperformance versus the equity market has become apparent since the start of June as investors take on more risk in stocks. Bonds remain in a period of seasonal strength through to October, however, underperformance is typical over the weeks ahead as the notorious summer rally period for stocks takes place.
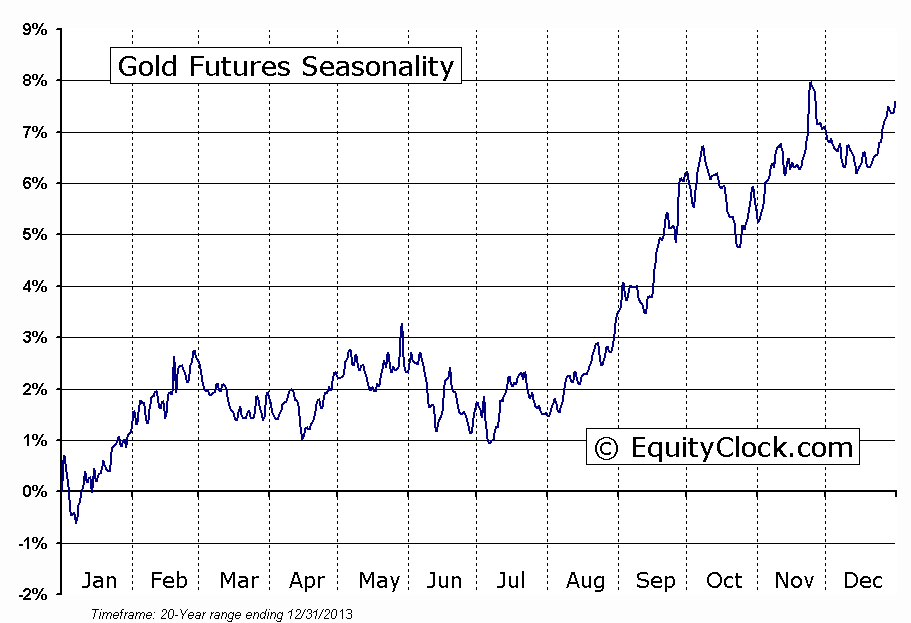
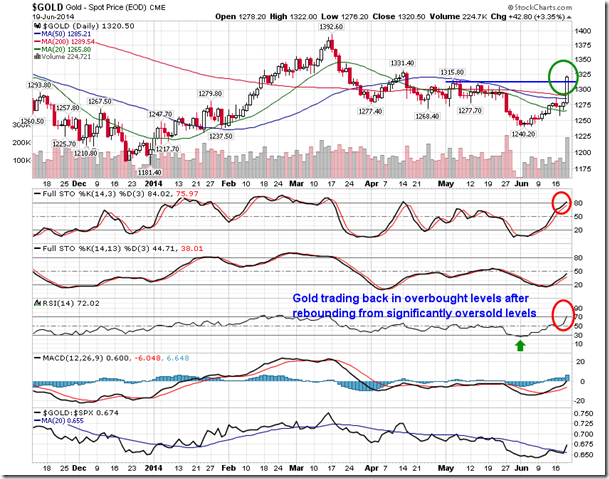
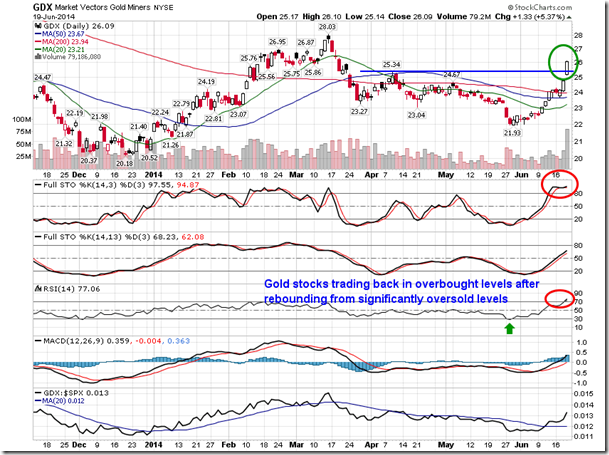
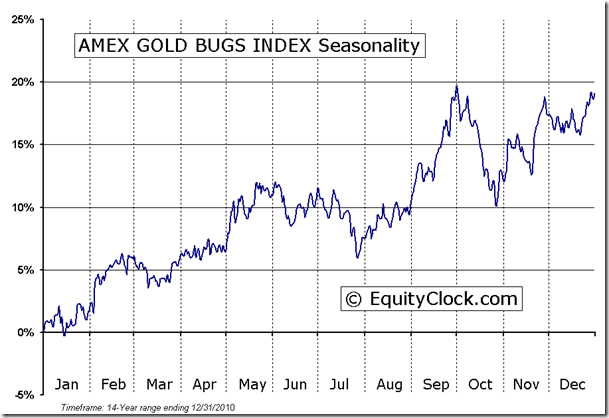
And finally, the significant move in the price of Gold on Thursday warrants attention. We initially wrote about Gold back on June 4th, highlighting the significantly oversold conditions and the period of seasonal strength that was directly around the corner. The basing pattern combined with the oversold state allowed for a low risk entry point for the period of seasonal strength that begins at the beginning of July; gains in the price of Gold since the June 4th report have now become significant, returning over 6%, while gold miners have returned over 16% in a very short period of time. Both Gold and Gold stocks have now become significantly overbought, increasing he risk of taking an entry point at present levels, even with the average start to the period of seasonal strength still weeks away. Gold is now trading above all significant moving averages, including the 20, 50, and 200-day, and resistance at the May peak was broken during Thursday’s session; next level of resistance is the April high at 1331.40. Commodities can often show wild swings surrounding the quarterly futures expiration date, which happens to be today, therefore activity during the week to follow will be indicative of the strength to come during the seasonally strong trend ahead.
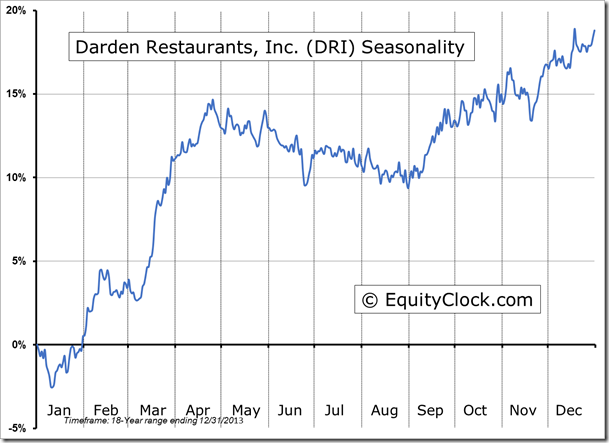
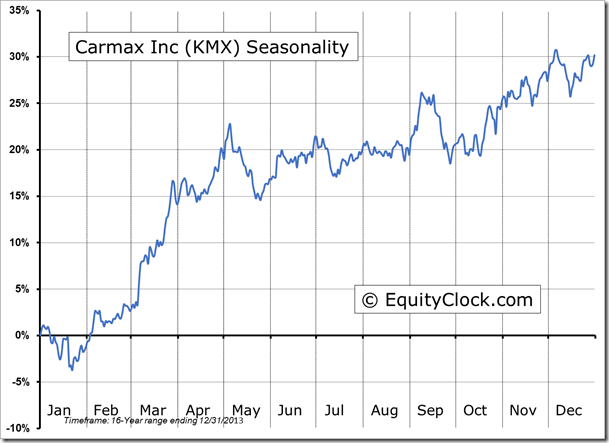
Seasonal charts of companies reporting earnings today:
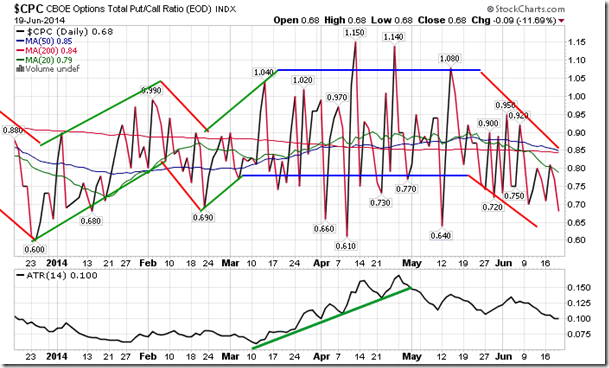
Sentiment on Thursday, as gauged by the put-call ratio, ended bullish at 0.68. The ratio is once again trading at the lower end of the recent bullish range, increasing the vulnerability of near-term equity market declines, from a contrarian perspective.
S&P 500
TSE Composite
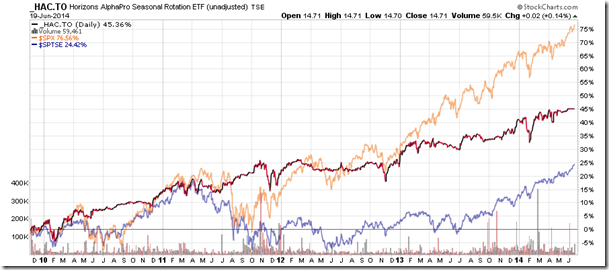
Horizons Seasonal Rotation (TO:HAC)
- Closing Market Value: $14.71 (up 0.14%)
- Closing NAV/Unit: $14.69 (up 0.05%)
Performance*
| 2014 Year-to-Date | Since Inception (Nov 19, 2009) | |
| HAC.TO | 2.73% | 46.9% |
* performance calculated on Closing NAV/Unit as provided by custodian
