Investing.com’s stocks of the week
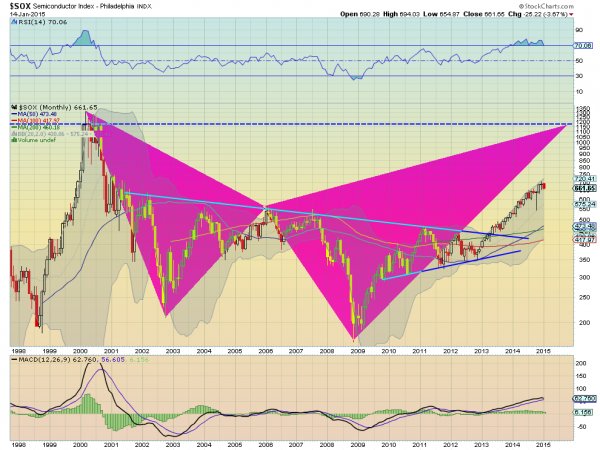
Philadelphia is famous for Freedom, Cheese steaks and the Philadelphia Semiconductor Index (SOX). While the SOX has not been around for 20 years yet, it has gained importance as a predictor of the S&P 500. Focusing on the index itself shows that broadly it has been in a range between 190 and 540 for nearly its entire life. A broad range, but also a long consolidation.
From 2010 to late 2013 that range tightened though. In fact, the falling trend resistance that dates back to 2001 started to act as the upside of a tightening range against rising trend support that goes back to 2010, producing a symmetrical triangle that the SOX broke out above in early 2013. The target for that break of the pattern was achieved at 660 in June at which point it consolidated for several months.

November 2014 saw it break consolidation to the upside though. The measured move now would target about 850 above. A quick look left on the chart shows that there is not much history between 750 and 1000 on the SOX, so a melt-up is a distinct possibility. It is slightly overbought in the RSI but the MACD shows a lot of room to run still and the chart just printed a Golden Cross, with the 50 month SMA crossing up through the 200 month SMA, a bullish signal.
There is also a bearish Shark harmonic at work. It has a Potential Reversal Zone I (PRZ) at 1193 (shown) and the PRZ II at 1465. It is called bearish because at the PRZ is where a bearish reversal could occur. But for the time being it gives a very bullish price objective.

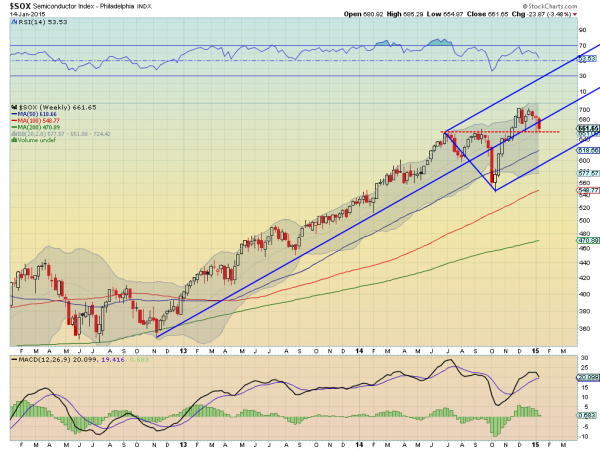
The weekly chart only reinforces this view higher. There is a smooth separation as all the SMA’s are rising. The Andrews’ Pitchfork tool applied since the trend began gives a view of the index riding higher between the Median and Upper Median Lines. It also highlights the 660 level mentioned earlier as resistance that is now acting as support.
The SOX then has an intermediate upside target in the trend to 850 with longer term targets at 1193 and 1465. But it also exhibits a relative vacuum of volume between 750 and 1000. Large upside targets and a lack of prior history mean that this indicator also gives a longer term positive view for the broader market.
Disclosure: The information in this blog post represents my own opinions and does not contain a recommendation for any particular security or investment. I or my affiliates may hold positions or other interests in securities mentioned in the Blog, please see my Disclaimer page for my full disclaimer.
