As we transition into the early Summer months, we are watching how different market sectors are reacting to the continued shifting of capital over the past 60+ days.
Certain market sectors are strengthening while others have run into resistance and are consolidating. We believe the next few weeks and months will continue this type of trend where capital continues to shift away from risks and into sectors that show tremendous strength and opportunity.
We wrote about how Precious Metals are likely starting a new bullish price trend last week. You can read that research article here: Metals and Miners.
We wrote about how the recent bullish price trend was based on a “wall of worry” and how the markets love to climb higher within this environment the previous week. You can read that research article here: U.S. Equities Climb A Wall Of Worry To New Highs. We also published an article the same week suggesting the Cannabis Sector had reached a Pennant Apex and would likely begin a new bullish price trend after some “shakeout” price volatility near the Pennant Apex.
Financial Sector May Rally Another 8% – 10% Or More
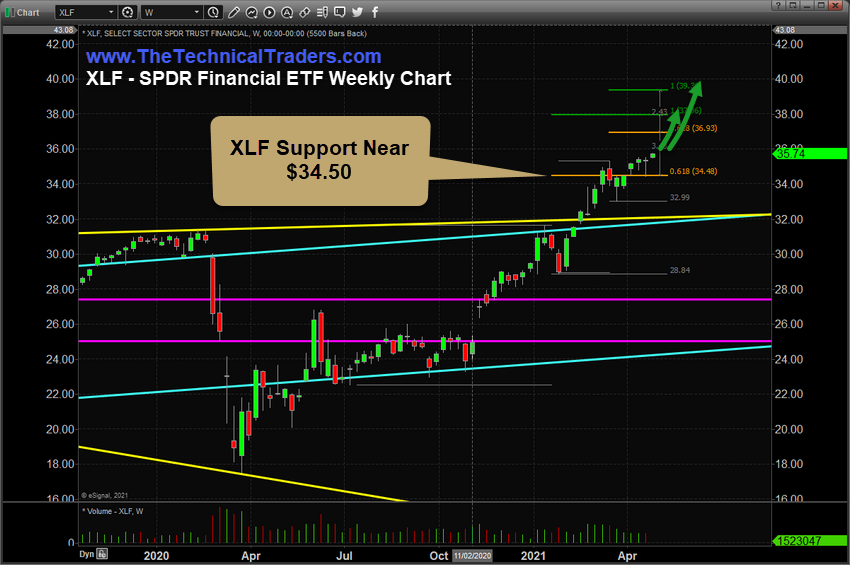
Today, we are revisiting a recent research article suggesting the Financial sector (NYSE:XLF) may be poised for another rally trend targeting the $38.00 level first, then the $39.40 level based on our research.
The financial sector continues to trend higher after the COVID-19 market collapse. Global central banks and government policies are very accommodating to stronger earnings and growth in the Financial sector. Recently, the US Government passed a new COVID stimulus bill that allocates money for at-risk borrowers to help elevate foreclosure actions.
It is very likely that these continued actions to support a stronger US and global recovery will translate into higher price trending in the Financial sector as we move into the Summer months—where weather and Summer activities push people back outside and into more active lifestyles.
Using our Fibonacci Measured Move technique, we have identified a support level in XLF near $34.50. Therefore, as long as price stays above this level, we believe a continued bullish price trend will push future prices towards the target levels near $38.00, then $39.40. We are watching for the next 0.61% Fibonacci level, near $36.93, to be breached as a sign the bullish price trend is accelerating.

Although the market may appear to be very extended and overbought, we still believe there is room to run for certain market sectors. XLF, ETFMG Alternative Harvest (NYSE:MJ), VanEck Vectors Junior Gold Miners ETF (NYSE:GDXJ), ETFMG Prime Junior Silver Miners ETF (NYSE:SILJ), and many others have recently moved into our watchlist for new bullish trends. Are you ready for profit from these moves?
Identifying the strongest sectors within the current market environment, as well as knowing when price trends generate clear entry triggers, can mean the difference between long-term targeted success and simply guessing at trades.
