My research team and I continue to believe the Cannabis/Alternative sector is poised for a big trend in 2021 and 2022. Over the past few years, this sector has continued to trend lower after the hype of 2016~2018 – back when everyone was getting into the Cannabis industry as multiple US states authorized recreational and medical use. After the 2018 peak, followed by the early 2019 moderate price recovery, this entire industry sector fell out of favor with investors for almost 2 full years.
MJ Pennant Setup Almost Complete
The peak in the ETFMG Alternative Harvest (NYSE:MJ), in September 2018 was $45.40. The lowest price since that peak was in March 2020 at $8.81 – that’s an 80% decline in price. Currently, MJ is trading near $22.31 and we’ve seen a tremendous recovery after the 2020 US elections. These elections resulted in a wave of enthusiasm for cannabis and alternative supply companies as it was widely expected the Democrats would move quickly to legalize cannabis and other illegal drugs after their win.
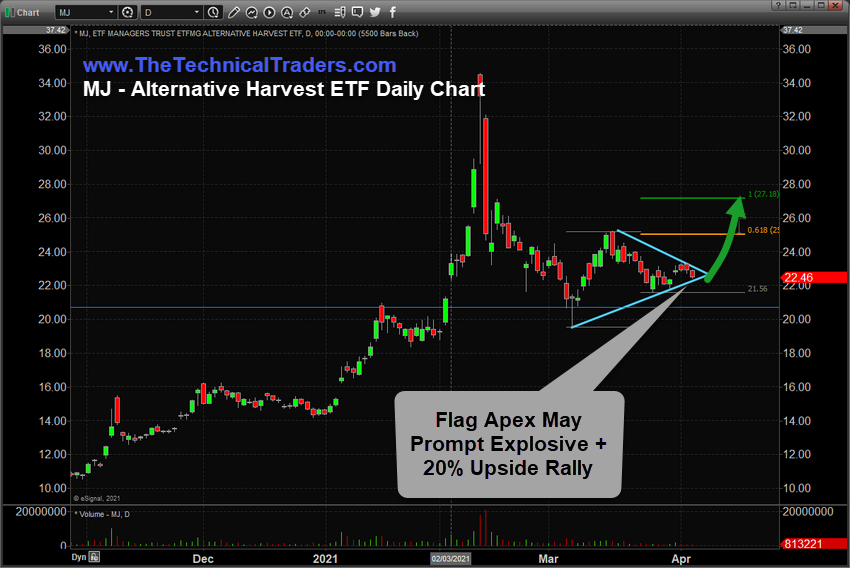
Looking at the MJ Daily chart below, MJ has retraced and stalled into a Pennant/Flag formation that we believe may prompt another explosive upside price trend. The Apex of any Pennant formation can be very volatile at times. Traders need to be prepared for wild price action as we near this Apex date. Yet, we believe the bias of the market, with a resurgence of the US economy and continued belief that the Democrats will attempt to push through Federal Cannabis legalization, may prompt another upside price wave.

A simple Fibonacci Measured Move of recent price action on this Daily MJ chart shows a potential for a minimum of +20% with a target near $27.18. Other cannabis stocks may be setup for even bigger gains.
Aurora Cannabis May Breakout Above $11 Very Quickly
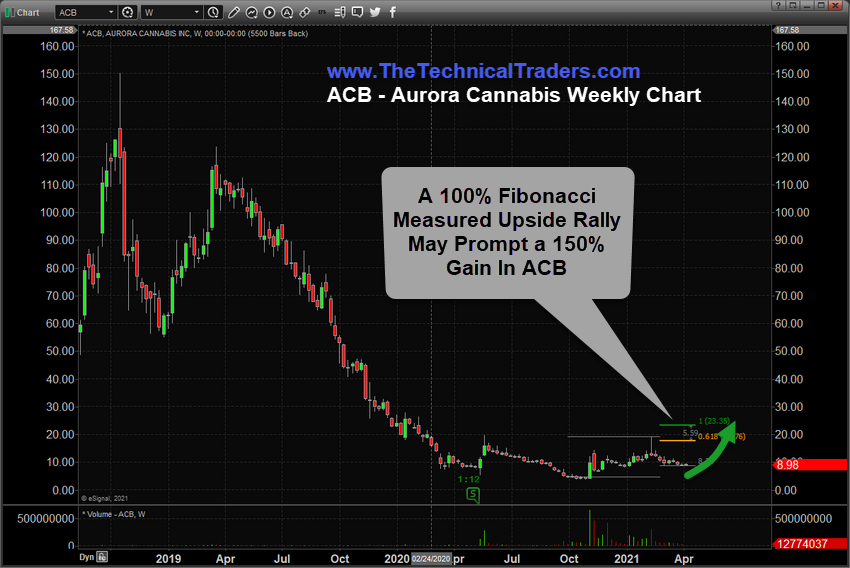
As we can see from the following Aurora Cannabis (NYSE:ACB) chart, which we highlighted in our Four Stocks To Own Before The US Elections follow up article, rallied from $3.71 to levels near $19 (a massive +423%) in just 4 months. If a true Fibonacci Measured move takes place from recent price lows (near $8.95), then we believe another +150% rally may be setting up in ACB with a target price level near $17.76, then $23.35. As amazing as that may seem, this won’t be happening overnight but rather is expected to unfold over the next weeks and months.

The rally in MJ could happen much quicker than the rally in ACB – yet both symbols seem poised for another upside price rally. If the US reflation trade continues to push the general market rally higher and US states continue to gradually reopen for business as usual, Cannabis will continue to grow in revenues and activity. The very deep contraction in this industry has barely just begun to reflect the projected growth over the next 5+ years.
