Low-volume rallies have become a standard of trending recently. We see higher volume when volatility kicks in near areas of broad market volatility. Otherwise, we see lower volume trending push the prices higher recently in a “melt-up” type of mode.
Two recent standout events confirm this type of trending and volatility phases of the markets: (1) the September 2020 to early November 2020 (pre-U.S. Election) rotation in price; and (2) the recent February 2021 to late March 2021 sideways price rotation related to the FOMC meeting/comments. Both of these events centered around external market components and prompted an extended period of price volatility related to uncertainty. After these events passed, price fell back into a low-volume rally mode for many months, where most of the actual price gains happened.
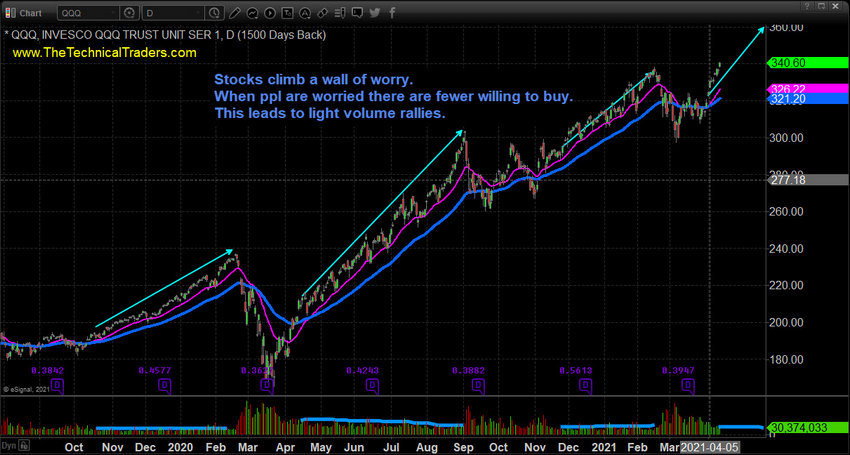
The following daily Invesco QQQ Trust (NASDAQ:QQQ) chart highlights my observations related to this type of price activity. We start in the pre-COVID-19 price rally from October 2019 to the peak near mid-February 2020. It is easy to see the decreased volume activity while prices climbed more than 27%. Then, the COVID-19 even sent volatility skyrocketing higher and prices collapsed by 30%. This type of “Wall Of Worry” trending is common and presents a very clear opportunity for traders.

After the March 2020 bottom, prices began another low-volume rally that lasted from April 2020 to August 2020 – totalling a substantial +45% gain. Again, starting in mid-November 2020 and ending in mid-February 2021, the QQQ rallied more than 15% in a low-volume “melt-up” trend.
Currently, the volume has started to subside after the FOMC meeting/comments volatility and we are starting to see moderately strong upward price trending in the QQQ. This suggests we have entered another “Wall Of Worry” trend that may continue for many weeks or months.
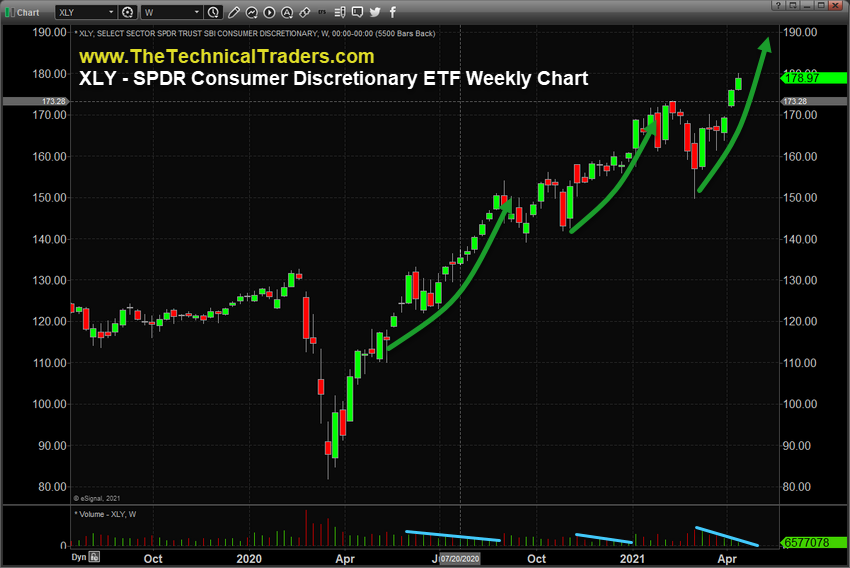
The following weekly Consumer Discretionary Select Sector SPDR® Fund (NYSE:XLY) chart highlights how diverse this “Wall of Worry” trend really is. It translates into other sectors with almost the same velocity as it does in the QQQ. In this example, we can see the strong trending, highlighted by GREEN ARROWS, at the same time as the decreasing volume took place. Each of these rally trends coincides with the QQQ trends. The rally from April 2020 to August 2020 represented a +35% gain. The rally from November 2020 to February 2021 represented a +21% gain. The current rally attempt has already advanced more than 17% higher and may continue to rally for many more weeks.

If there is no future disruption of this low-volume trending, then we may expect to see the U.S. stock market continue to move in this manner for many weeks or months to come. These low-volume “Wall Of Worry” trends can be very profitable and can prompt big moves in sector ETFs.
