The main take away from the last 24h, even if sadly not translated on a pick up in currency volatility, is the notion that the Fed may be preparing the market for a potential shift in policy. That's the only sensible conclusion if one listens to what Fed's Vice Chair Clarida, the most important voice at the helm of the Fed after Chair Powell, had to say.
Quick Take
The main take away from the last 24h, even if sadly not translated on a pick up in currency volatility, is the notion that the Fed may be preparing the market for a potential shift in policy. That's the only sensible conclusion if one listens to what Fed's Vice Chair Clarida, the most important voice at the helm of the Fed after Chair Powell, had to say. The policymaker opened the door for the Fed turning more accommodative if certain pre-conditions are met, which on its own, is a strong statement of intentions. The fixed income market was again a sea of healthy buy-side volatility (lower yields), translated in the recovery of the Yen from the lowest levels it's traded this week. The USD, surprisingly, was rather unperturbed by the dovish remarks from Clarida, and with month-end FX hedge rebalancing skewed towards moderate to strong USD buying due to the underperformance in US equities as the trade war escalates, the price action in the EUR/USD is already acting as a precursor of the combatant stance by the DXY into Friday. Interestingly, even as Crude Oil keeps selling off, the Canadian Dollar has followed in locksteps the USD as the currency managed to navigate quite successfully the BOC test after the Central Bank sounded quite neutral, which by default should be interpreted as rather positive in a world of dovish Central Banks. Along these lines, the next one set to bite the bullet, especially after the latest Capex reading, is the RBA, an outcome the market has fully priced. The Aussie is still putting in a fight. With regards to the European currencies, the Euro enjoyed firmer pockets of demand, while the Sterling is still on selling mode as Germany mulls a veto on extending the Brexit process beyond October.
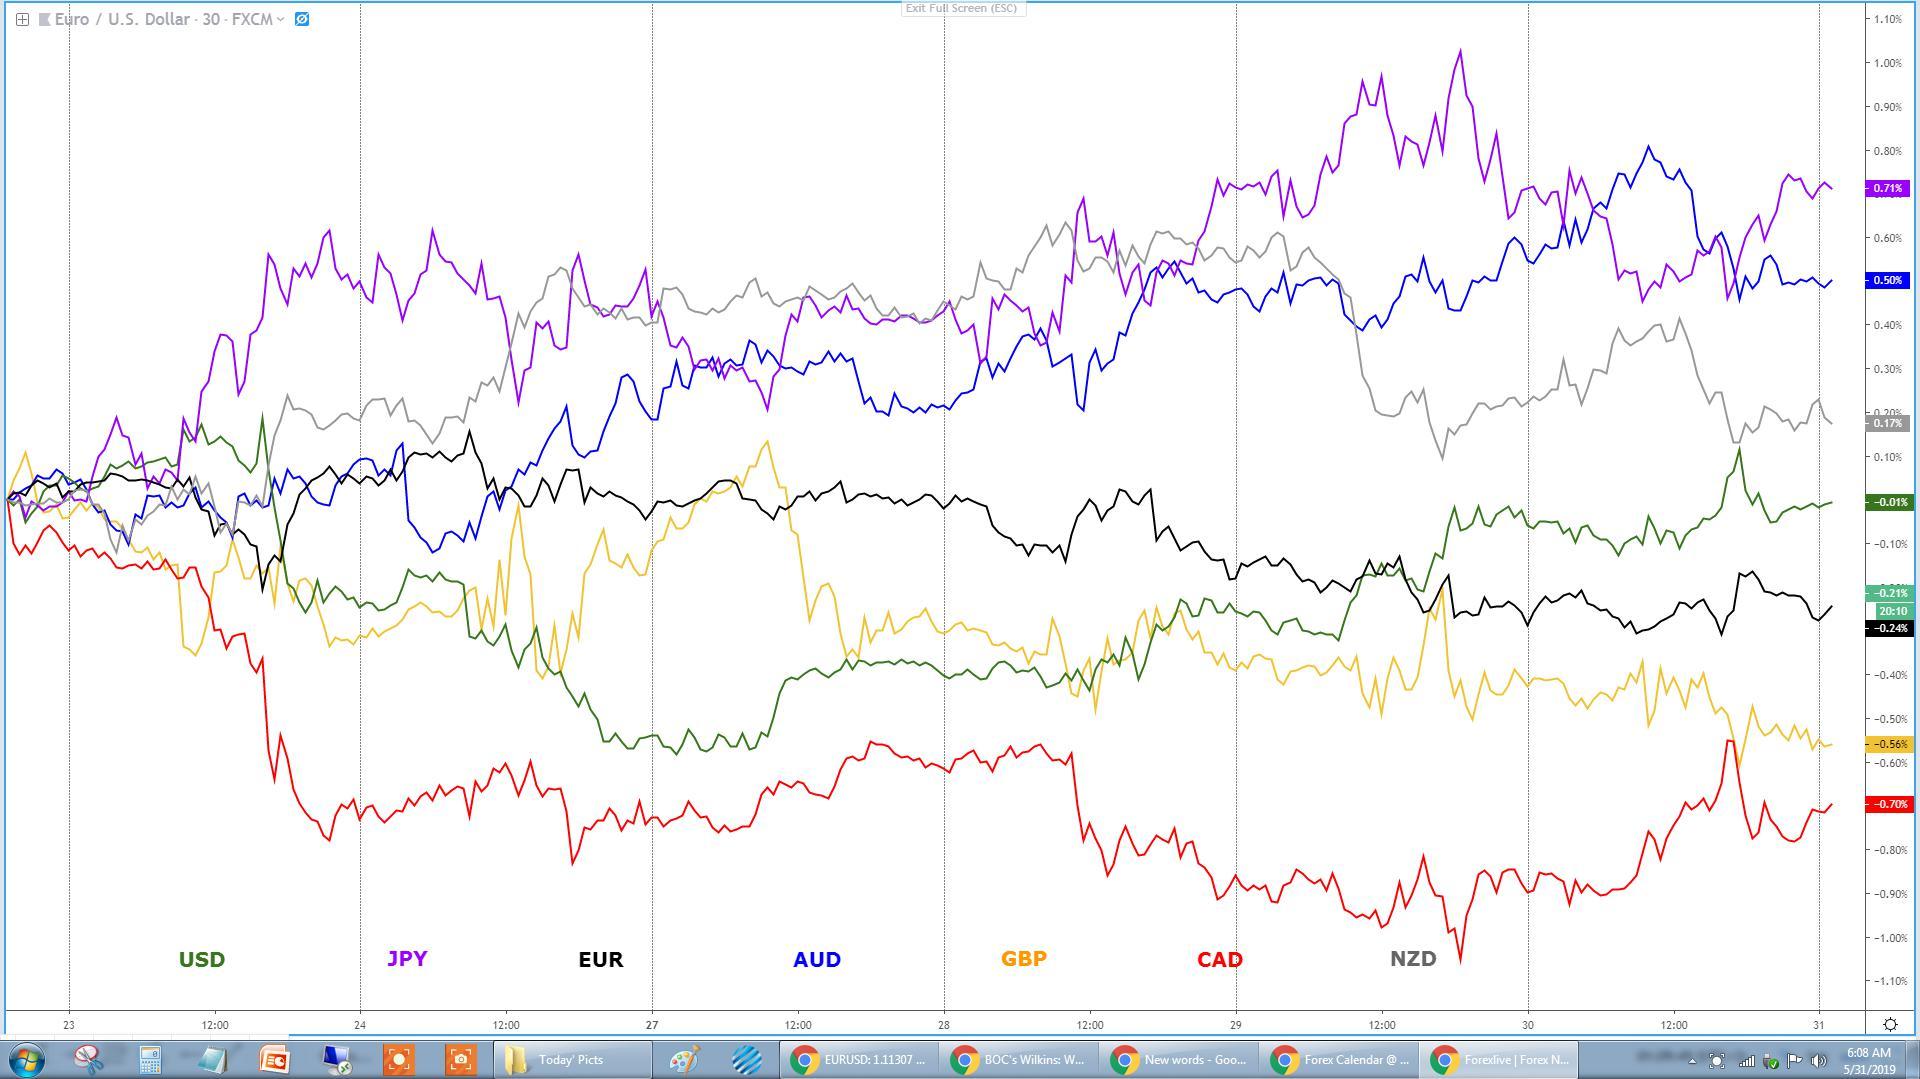
Narratives In Financial Markets
* The Information is gathered after scanning top publications including the FT, WSJ, Reuters, Bloomberg, ForexLive, Institutional Bank Research reports.
- There is no denying that the psyche of the market has transitioned into a glass half empty when it comes to the outlook for growth, both in the US and globally. That’s what the resumption in the US yields downtrend predicates, as well as a market in disbelief about the ability of the Fed to keep its policy neutral (cuts expected).
- Federal Reserve Vice Chairman Richard Clarida made a statement in line with the market pricing (anticipation) of heightened risks of a more dovish Federal Reserve. The policymaker seems to have opened the door to a rate cut by stating “downside risk could call for more accommodative policy”, outlining the marked retreat in the global growth outlook.
- The month-end FX hedge rebalancing model from banks such as Barclays (LON:BARC) or Citi favor moderate to strong USD buying due to the significant underperformance in US equities.
- Germany vows not to flex its muscle by allowing another extension in the Brexit process beyond October this year unless major progress made, according to the Telegraph. Not a time-sensitive piece of information at this stage but something to factor in.
- News by Bloomberg that China is reportedly putting US soy purchases on hold is yet another piece of evidence that vindicates the unstoppable escalation in trade tensions.
- Defiant words from China’s commerce ministry once again, noting that China will fight till the end if the US keeps threatening the sovereign pride of China.
- Vice President Mike Pence sends a bold statement to China, implying that if the US sees no end to the conundrum in trade talks, it could ‘more than double; tariffs if needed. Pence left up in the air whether or not Trump will meet Xi at the G20 summit in Osaka (Japan) in June.
- A less than expected draw in US crude oil inventories (-282k vs -1,360k) sends the price of Oil further down, which combined with the headwind risks of a decrease in demand as the global economy slows down, keeps sellers firmly in control in line with falling yields.
- US April pending home sales fell by 1.5% vs +0.5% exp, which has some analysts scratching their heads as the backdrop of a firm job market and low rates is conducive for a pickup. Meanwhile, US Q1 GDP (2nd reading) came a tad improved at +3.1% vs 3% exp, even if business investment continues to be one of the weakening components.
- The significant revision down in the core PCE deflator in the US by 0.3% from 1.3% to 1% reinforced the conviction to sell yields as it implies higher risks of low inflation.
- Bank of Canada senior deputy governor Wilkins, threw mixed comments, on one hand stating that solid growth in jobs/wages must be reconciled with weak consumer spending, adding that clouds over trade disputes could clear, which would be an upside risk to Canadian and global economies. On the latter, a big ‘IF’ at this stage.
- Australia's Capex spending slid by -1.7%Q in Q1 vs expectations of a jump with most sectors softening, which adds to the case for the RBA to cut rates next week. Spending intentions for FY19 and FY20 were barely changed suggesting a slow down in growth. The Economics Team at Morgan Stanley (NYSE:MS) notes that "including this into our tracker for Q1 GDP next week suggests another weak print (0.3%Q)."
- Today's China manufacturing PMI will set the tone for the risk environment in Asia. China economic data has been on a downtrend in Q2 after an encouraging pickup in Q1. The most recent UBS data shows that "the economy continued to decelerate further in May, as our indicators for industrial production, consumption sales ex-autos, property sales, and auto sales look worse than April."
Recent Economic Indicators & Events Ahead
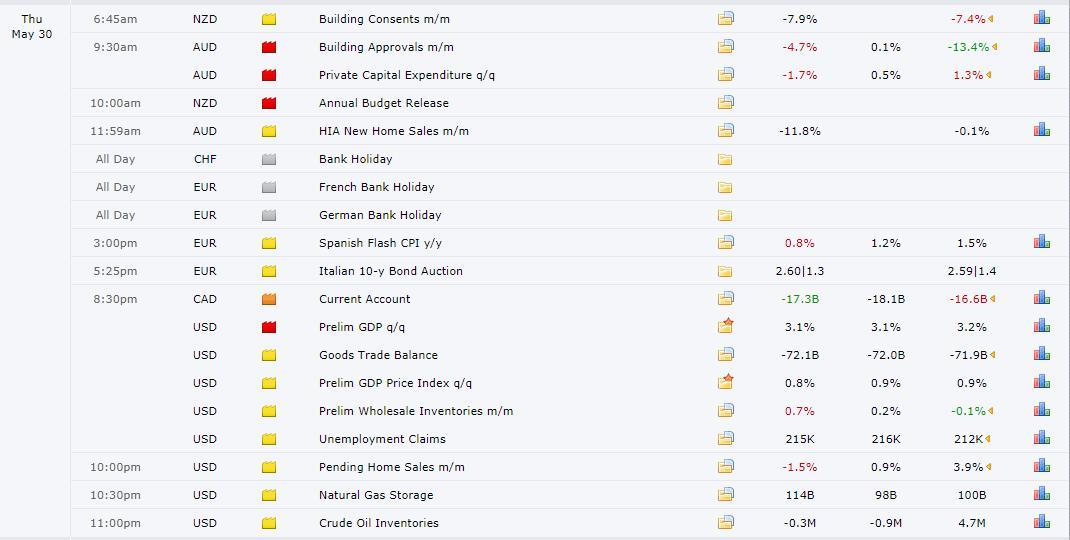
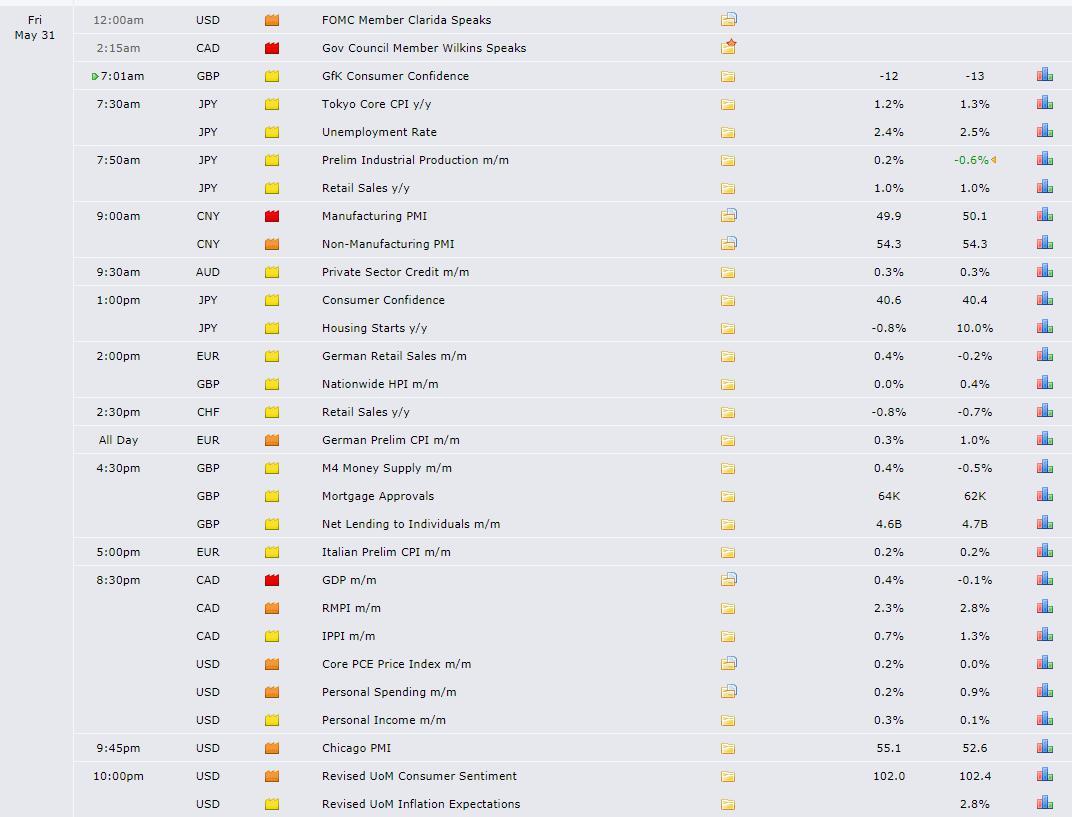
Source: Forexfactory
RORO (Risk On, Risk Off Conditions)
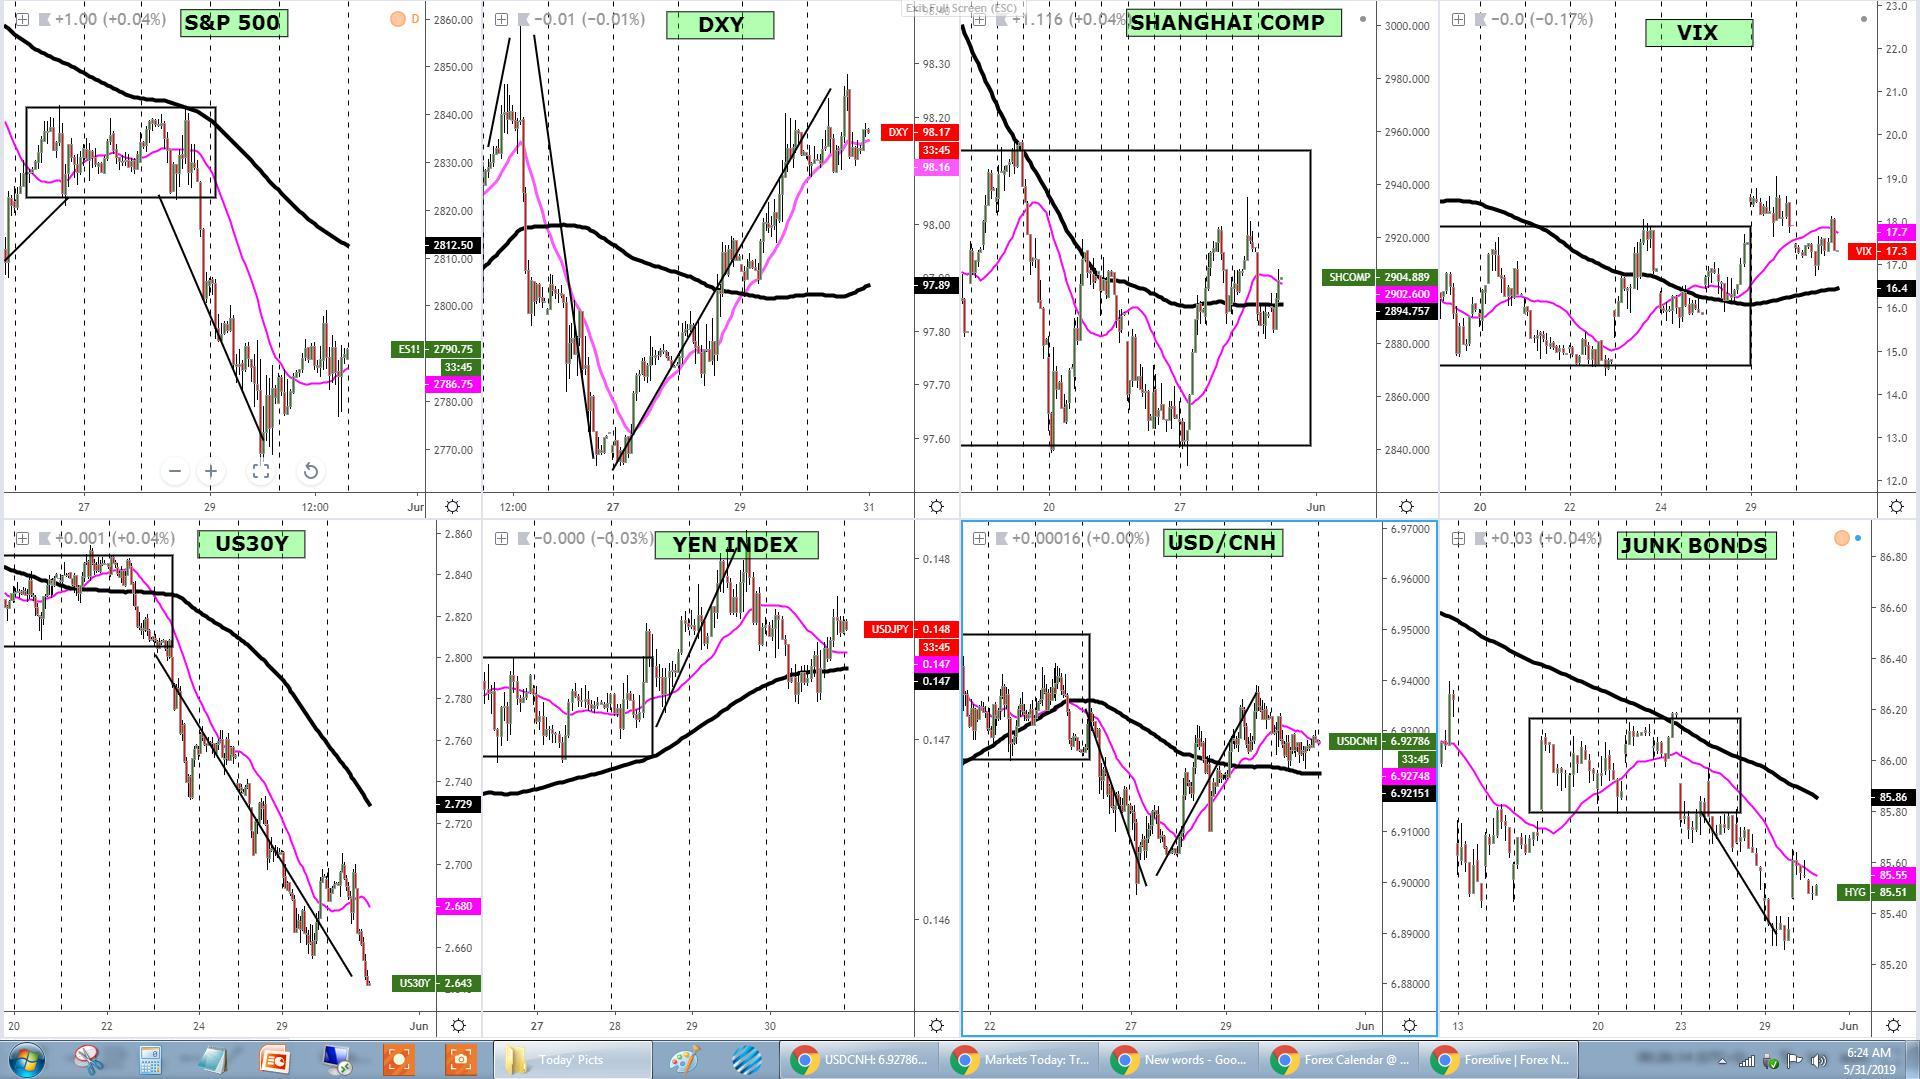
Lingering dark clouds for the global growth outlook is the resounding and unambiguous message sent by the hammering of US yields, further intensified by Fed’s Vice Chair Clarida. By stating “downside risk could call for more accommodative policy”, I personally consider IT to be a rather bold ‘off-the-cuff’ hint that the Fed may indeed start preparing the market for a rate cut down the road. The immediate response by market forces has been to depress even further the US yields as larger pools of capital flock off to fixed income as the option of last resort to get paid amid expectations of lower rates. In the equity market, with the S&P 500 our global guidance to take the pulse in sentiment, a shallow bounce has allowed the 25-HMA, which serves as our micro trend cue, to turn mildly positive.
When it comes to crosscurrents in the currency market, the DXY is largely unchanged, benefited by the bearish trend in the Euro since the fragmented European parliamentary election results, while the Yen keeps the firm bullish structure intact. As every day, we also can look at the Chinese assets’ performance to decipher the mood of investors around the trade standoff between the US and China. Price action still suggests pessimism prevails as the USD/CNH consolidations around 6.93, a level that manages to offset the 10% tariffs via a cheaper Yuan exchange rate, while the Shanghai Composite trade within a range at year lows. Lastly, with a VIX (implied vol in the S&P 500) finding a firm footing at elevated levels around the 17.00 mark, and with junk bonds in the US on a clear downtrend, the risk outlook remains as poor as it’s been this week.
Latest Key Developments In FX (Technicals, Fundamentals, Intermarket)
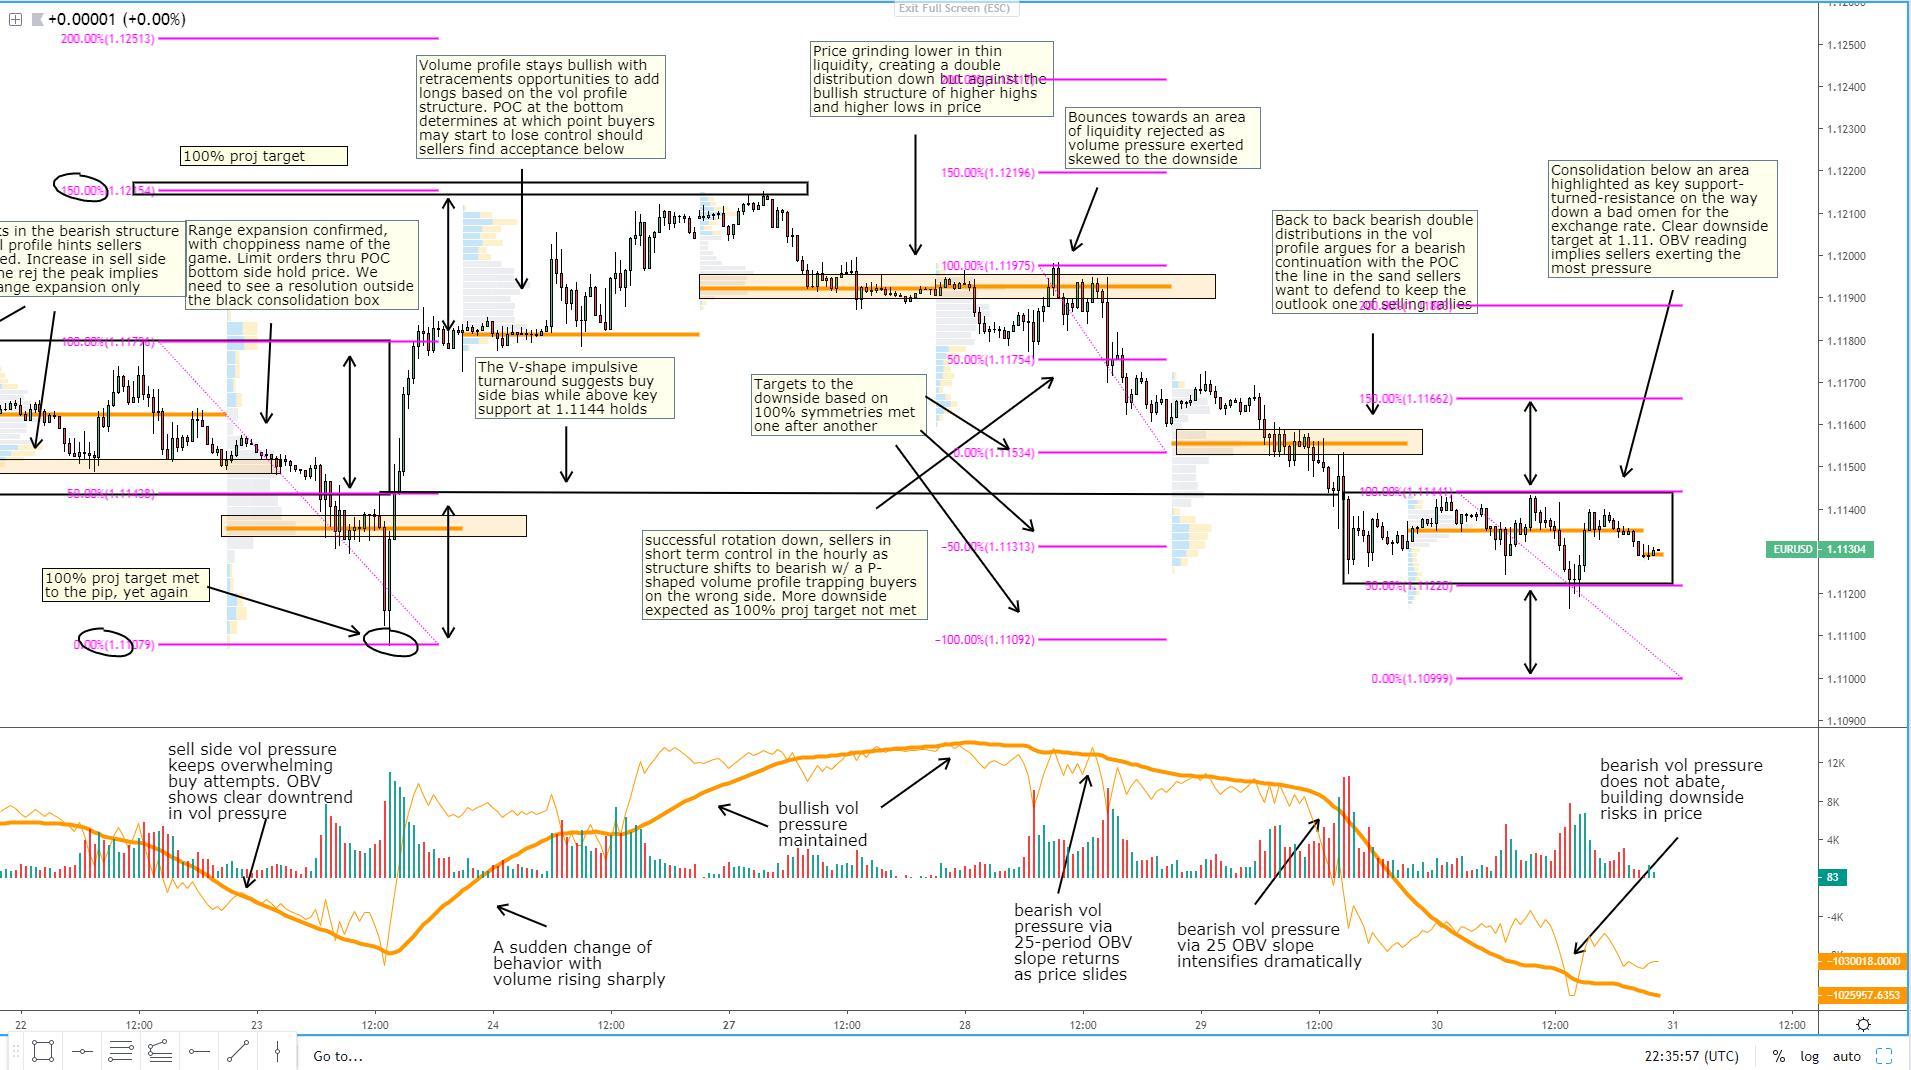
EUR/USD: Balanced Flows In Line With Bearish Context
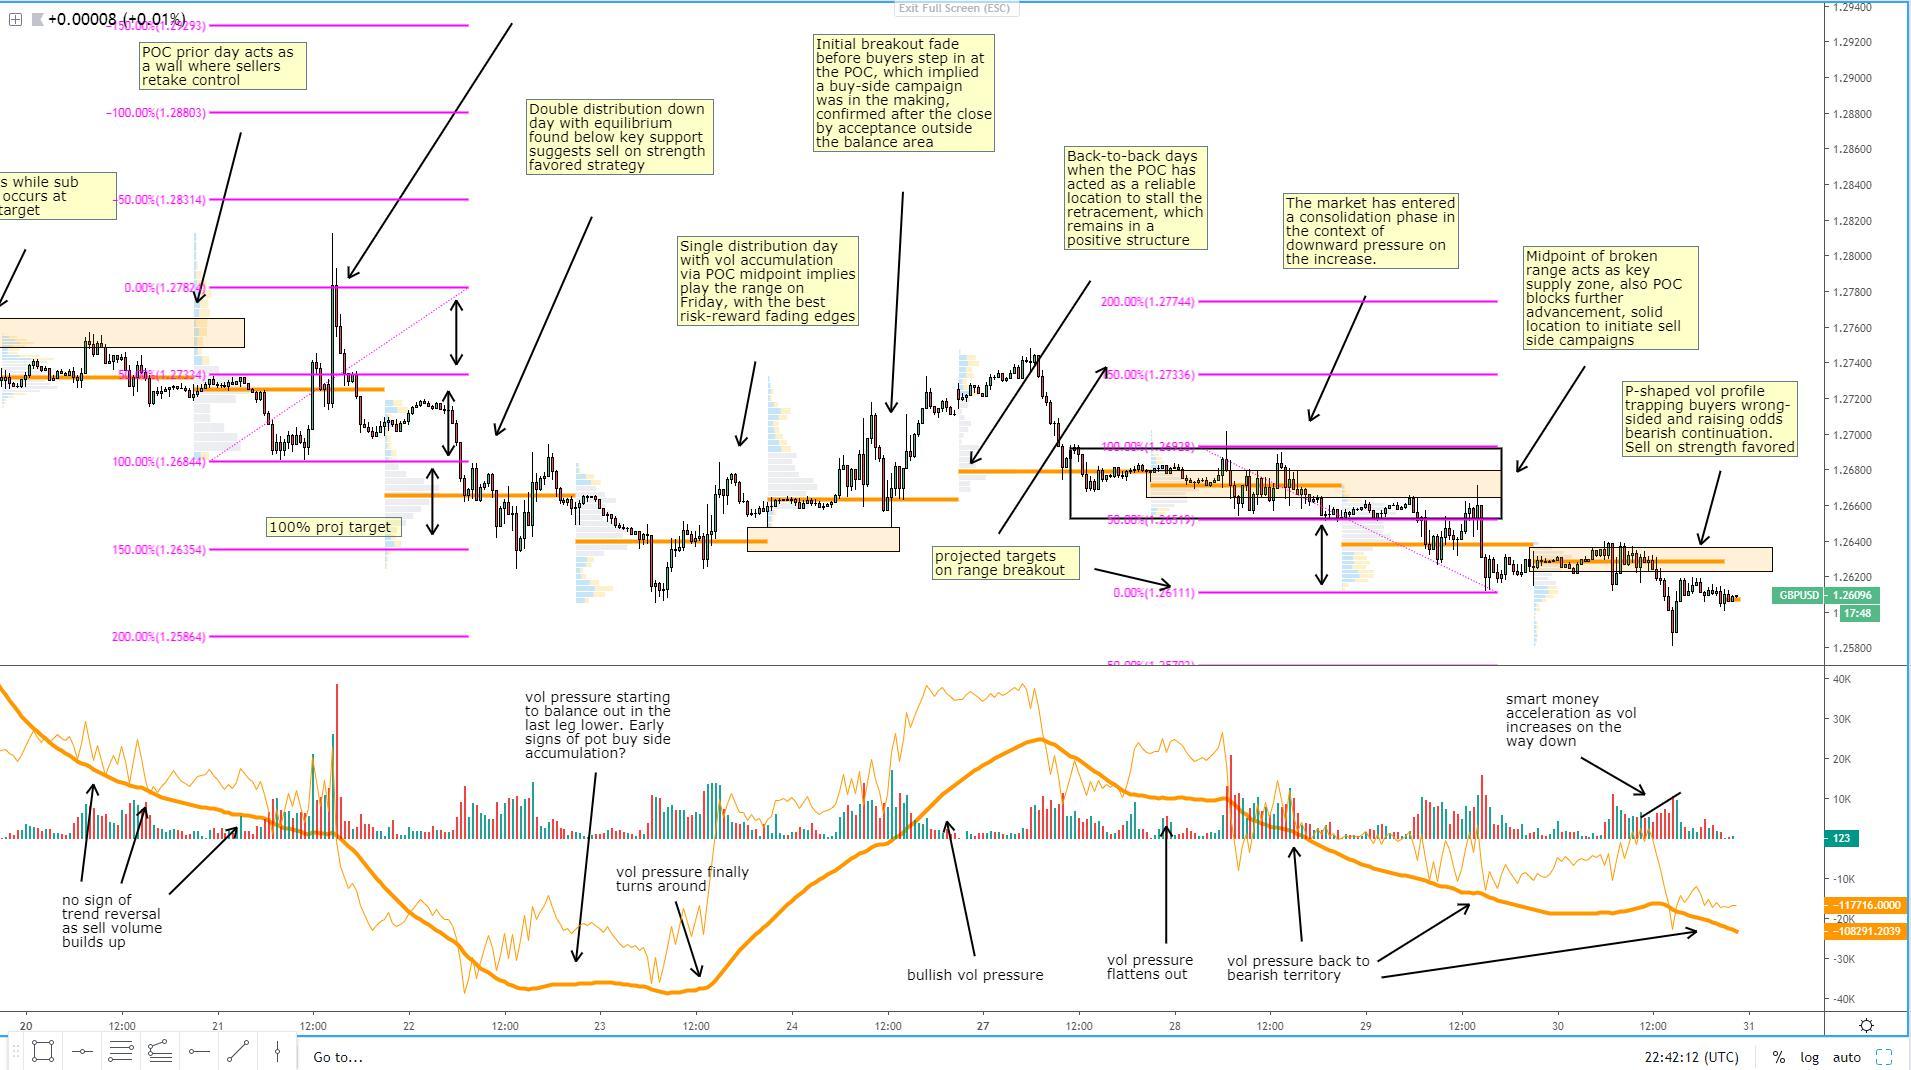
GBP/USD: Sell Strength If Vol Profile As Indication
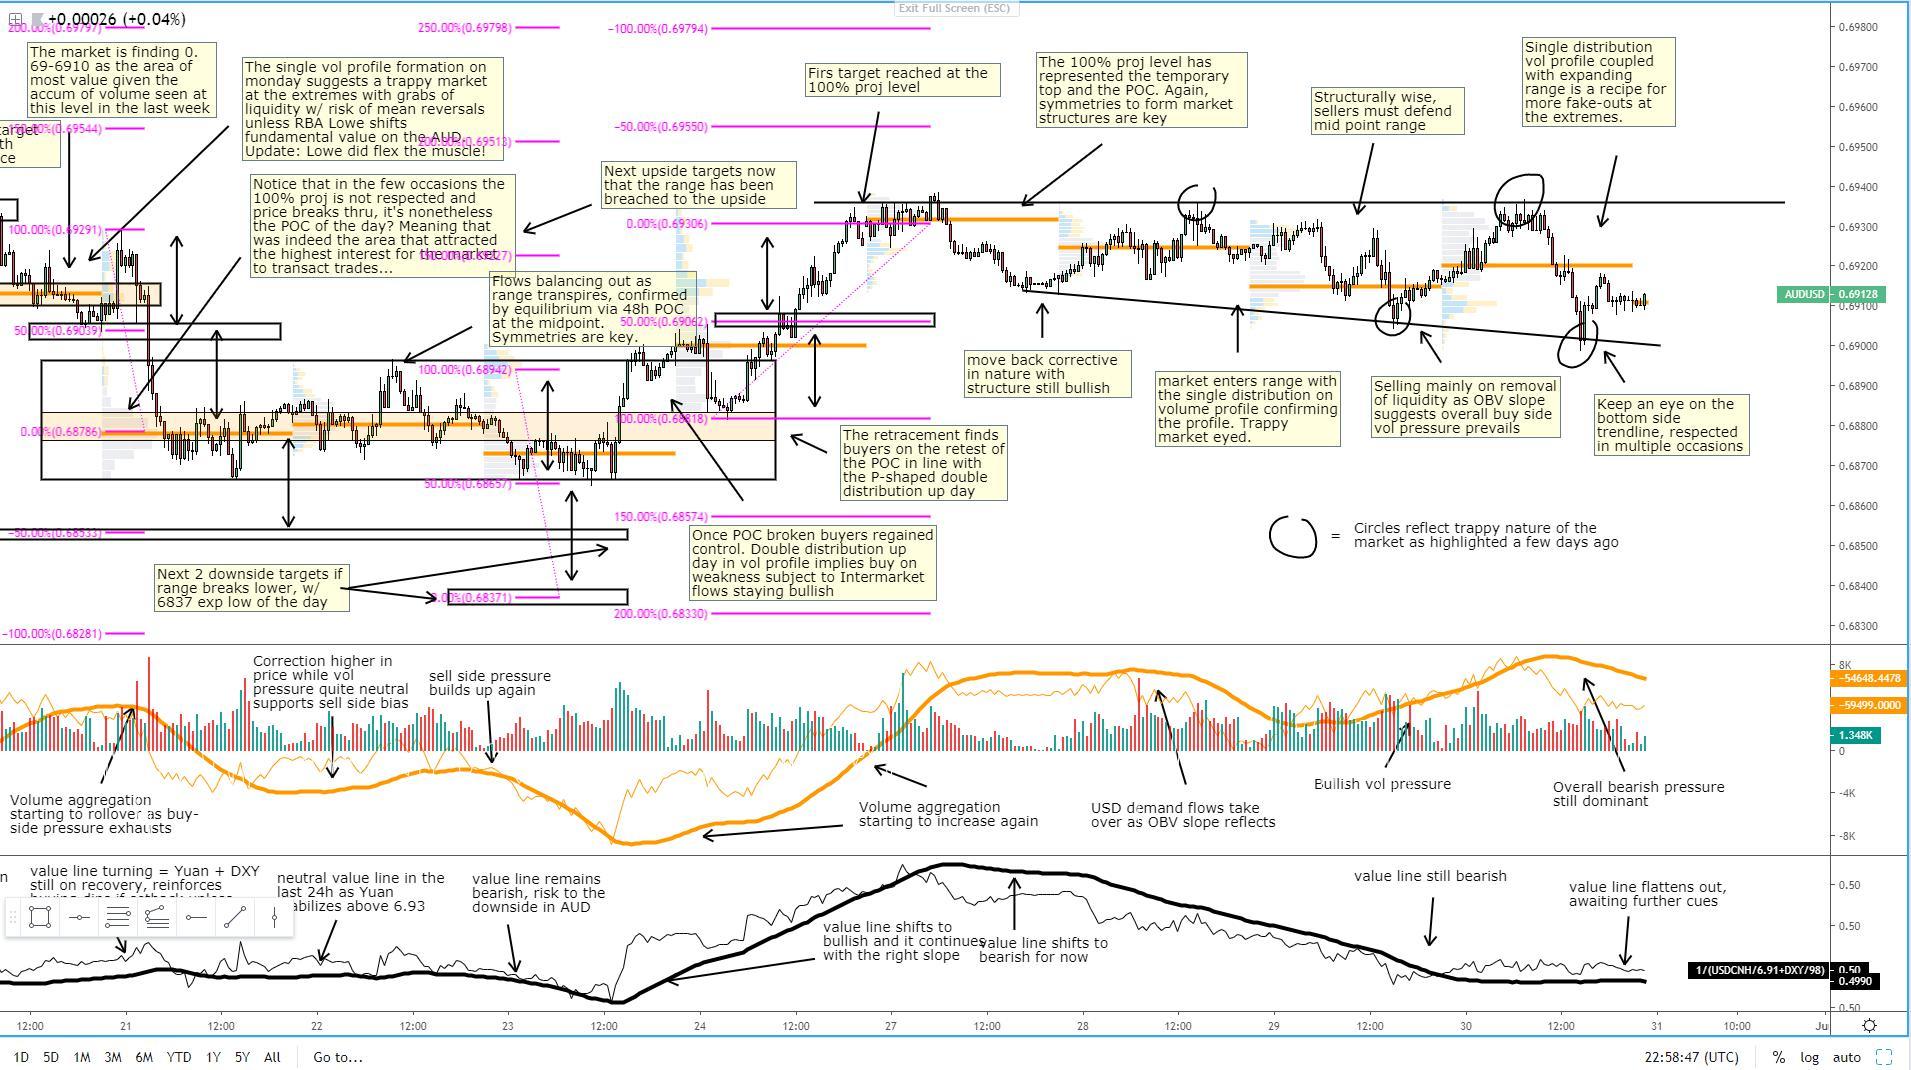
AUD/USD: FakeOut At The Edges As Single Distributions Persist
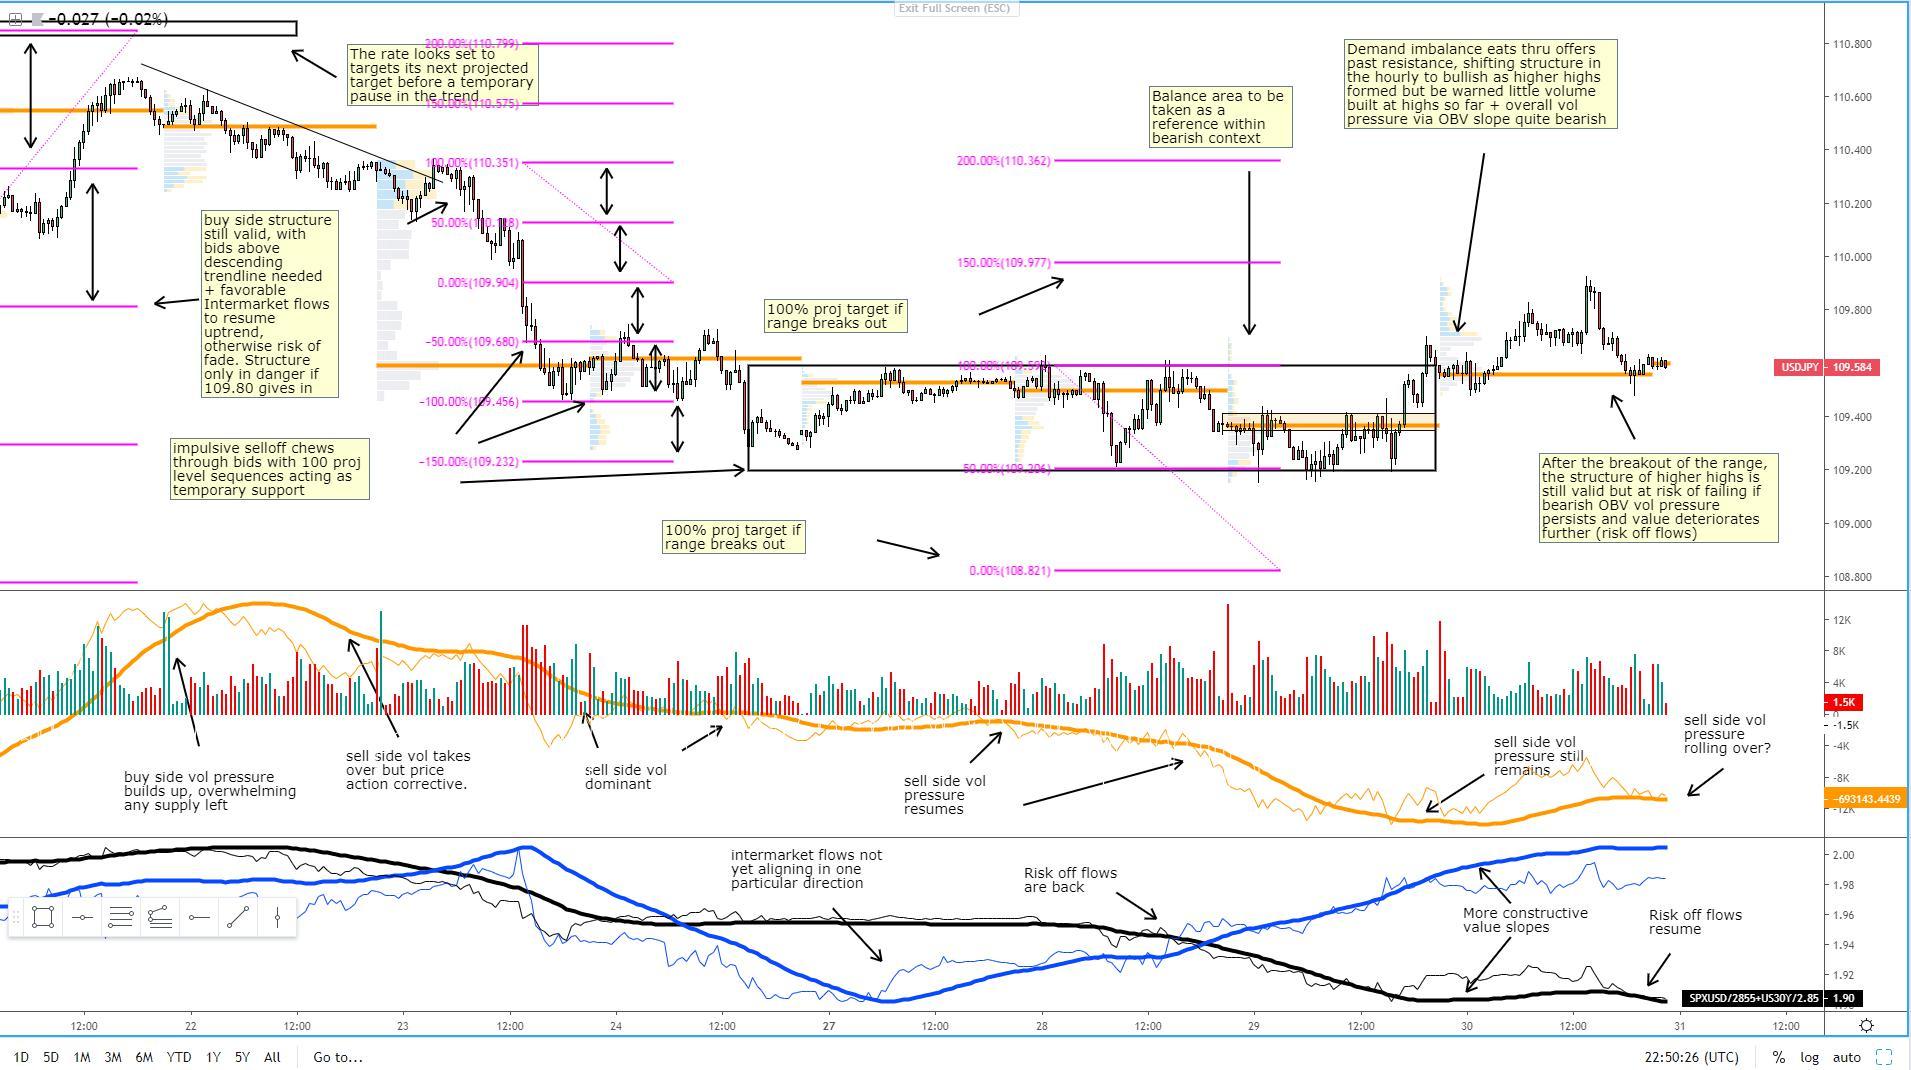
USD/JPY: Dubious Uptrend As Volume + Value Unsupportive
Important Footnotes
- Risk model: The fact that financial markets have become so intertwined and dynamic makes it essential to stay constantly in tune with market conditions and adapt to new environments. This prop model will assist you to gauge the context that you are trading so that you can significantly reduce the downside risks.
- Cycles: Markets evolve in cycles followed by a period of distribution and/or accumulation. The weekly cycles are highlighted in red, blue refers to the daily, while the black lines represent the hourly cycles.
- POC: It refers to the point of control. It represents the areas of most interest by trading volume and should act as walls of bids/offers that may result in price reversals. The volume profile analysis tracks trading activity over a specified time period at specified price levels. The study reveals the constant evolution of the market auction process.
- Tick Volume: Price updates activity provides great insights into the actual buy or sell-side commitment to be engaged into a specific directional movement. Studies validate that price updates (tick volume) are highly correlated to actual traded volume, with the correlation being very high, when looking at hourly data.
- Horizontal Support/Resistance: Unlike levels of dynamic support or resistance or more subjective measurements such as fibonacci retracements, pivot points, trendlines, or other forms of reactive areas, the horizontal lines of support and resistance are universal concepts used by the majority of market participants.
- Trendlines: Besides the horizontal lines, trendlines are helpful as a visual representation of the trend. The trendlines are drawn respecting a series of rules that determine the validation of a new cycle being created. Therefore, these trendline drawn in the chart hinge to a certain interpretation of market structures.
- Correlations: Each forex pair has a series of highly correlated assets to assess valuations. This type of study is called inter-market analysis and it involves scoping out anomalies in the ever-evolving global interconnectivity between equities, bonds, currencies, and commodities.
- Fundamentals: It’s important to highlight that the daily market outlook provided in this report is subject to the impact of the fundamental news. Any unexpected news may cause the price to behave erratically in the short term.
- Projection Targets: The usefulness of the 100% projection resides in the symmetry and harmonic relationships of market cycles. By drawing a 100% projection, you can anticipate the area in the chart where some type of pause and potential reversals in price is likely to occur, due to 1. The side in control of the cycle takes profits 2. Counter-trend positions are added by contrarian players 3. These are price points where limit orders are set by market-makers.

