February ‘17 Market Preview,
The chart indicators are as follows:
Up Arrows - Mean Reversion Buy Signal. Should be considered in context. A failure of the lows can create overhead resistance for a sell setup.
Rectangle boxes - Price Action Gap. Shows areas where price spent very little time during lower timeframes. These areas contain low volume and act as suction tubes, or black holes.
Horizontal Ray with small arrow - Trend Break Alert with Stop and Reverse Marker. This alerts traders to trend reversals.
Leftside Volume Profile Indicator - Plots contracts traded at price.
Dashed line over volume panel - indicates 20 period regression.
Solid line over volume panel - indicates 3 period regression.
Uptrend, Downtrend or Balanced notation in lower left corner - Calculates the directional bias over the past 5 bars.
The following Weekly and Monthly charts represent general directional bias and in some cases specific entry levels. Entries should be confirmed with the Daily charts for added accuracy.
All lines drawn on the charts indicator key inflection points for support and resistance.
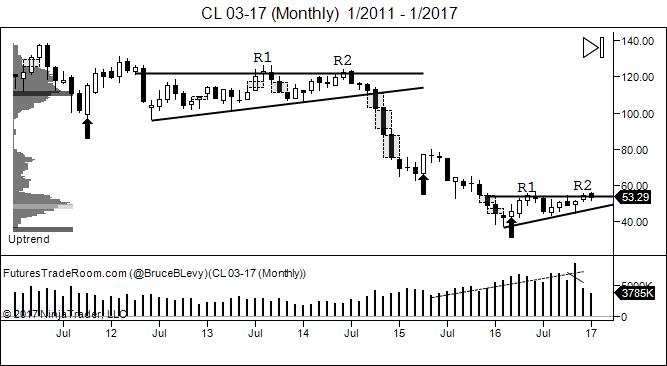
Crude Oil 03-17 (Monthly)
Crude Oil has been overlapping sideways over the past few weeks. It appears to have an upward bias since it is putting in higher lows, the problem is volume is drying up and it is having trouble spending time at higher prices. I have not given any signals in Crude for a while due to the overlapping trendless environment.
The above image shows two bearish wedges that are almost identical in development other than for the duration. The duration has a lot to do with how far the move is expected to go. The lows are rising because participants have been expecting higher prices for a long time, however the fundamentals simply aren't matching up and eventually it falls apart. As you can now imagine there is a lot of confusion in the crude market. New rigs are set to come online and more production is expected. At the same time OPEC is talking about cutting supply; the market is confused and will continue to be until new reliable information comes in. The pattern appears to be at its completion point which is in conjunction with the US Election. At this time it appears to me that many markets are showing sideways, or overlapping behavior. I suspect crude to either make a decisive move in one direction, or become very volatile and test wide trading ranges. Trading while a market is testing its limits is very unpredictable. If this were to happen we would sit idle and let the chart show us what it wants to do. We want to see a close outside of a consolidation zone as well as a retest and failure of that level which would confirm the support or resistance is real. At that point we would be allowed to take a position.
In a previous issue we mentioned buying crude on a 2-day close above the highs near 53. A two day close means the Daily candle closes above 53 for two consecutive days. This would be a significant long trigger. I would rate this suggesting as very high risk because at the moment there is nothing in the chart that suggests higher prices other than a clear defined breakout line. The real play here may be to sell a failed breakout of the highs and ride the pattern down to new lows.
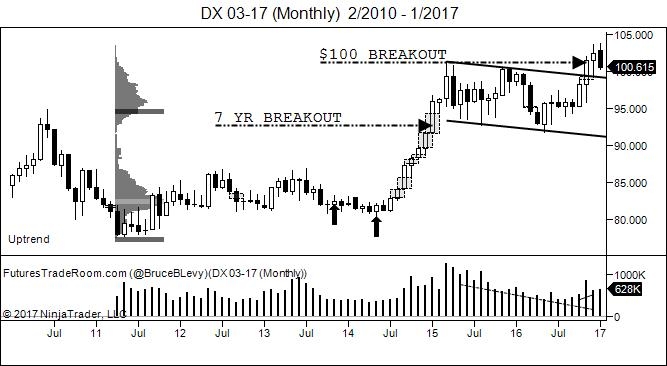
US Dollar Index 03-17 (Monthly) Pullback to support
The USD broke out and closed outside of the 2 year channel in November. December was indecisive and January has suggested the DX to pullback to the breakout level near $100. How far this will dip is unknown, however the larger pattern suggests the dip to support to be met with additional buying. A close above the November candle high will confirm the breakout measured move to $120 which is found on the next chart.
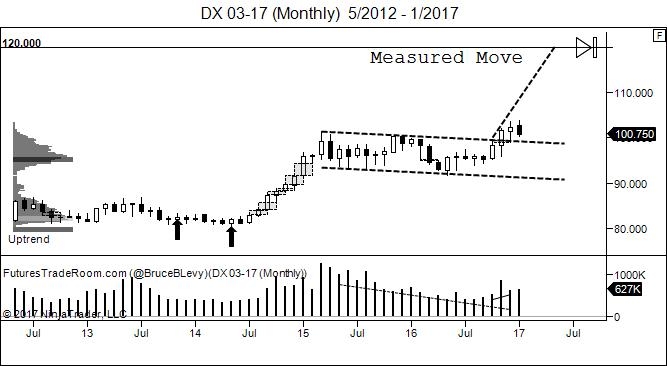
Dollar 03-17 (Monthly) Measured Move to $120?
A measured move to $120 could take 6-12 months if it were to do so in the same manner as it did in mid 2014 when it left multiple price action gaps from $80 to $100. The breakout above $100 is the first confirming trigger of this pattern. The price action should stay above $96 for this pattern to be effective.
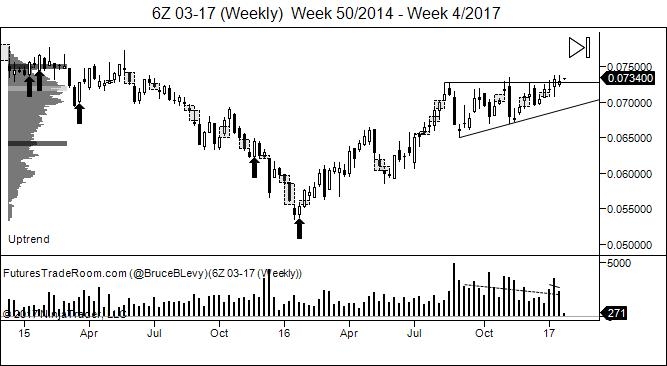
South African Rand 03-17 (Weekly) Ascending Triangle
An Ascending Triangle is ready to breakout on the 6Z. When analyzing the daily charts the bars tend to gap so giving this enough room to develop is key.
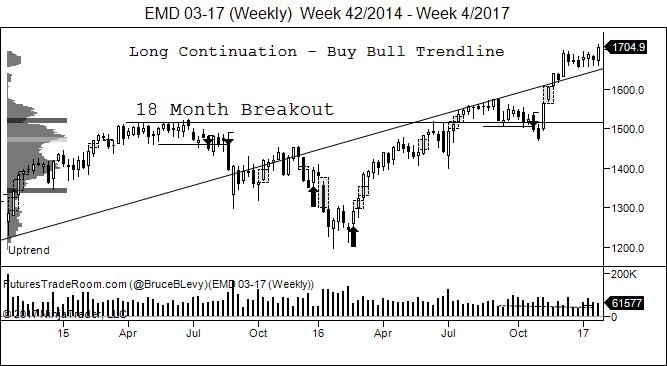
EMD 03-17 (Weekly) Above Bull Trendline
The EMD has proven its willingness to move to higher prices by developing nicely above the bull trendline. It is currently breaking out above the prior 6 week consolidation zone.
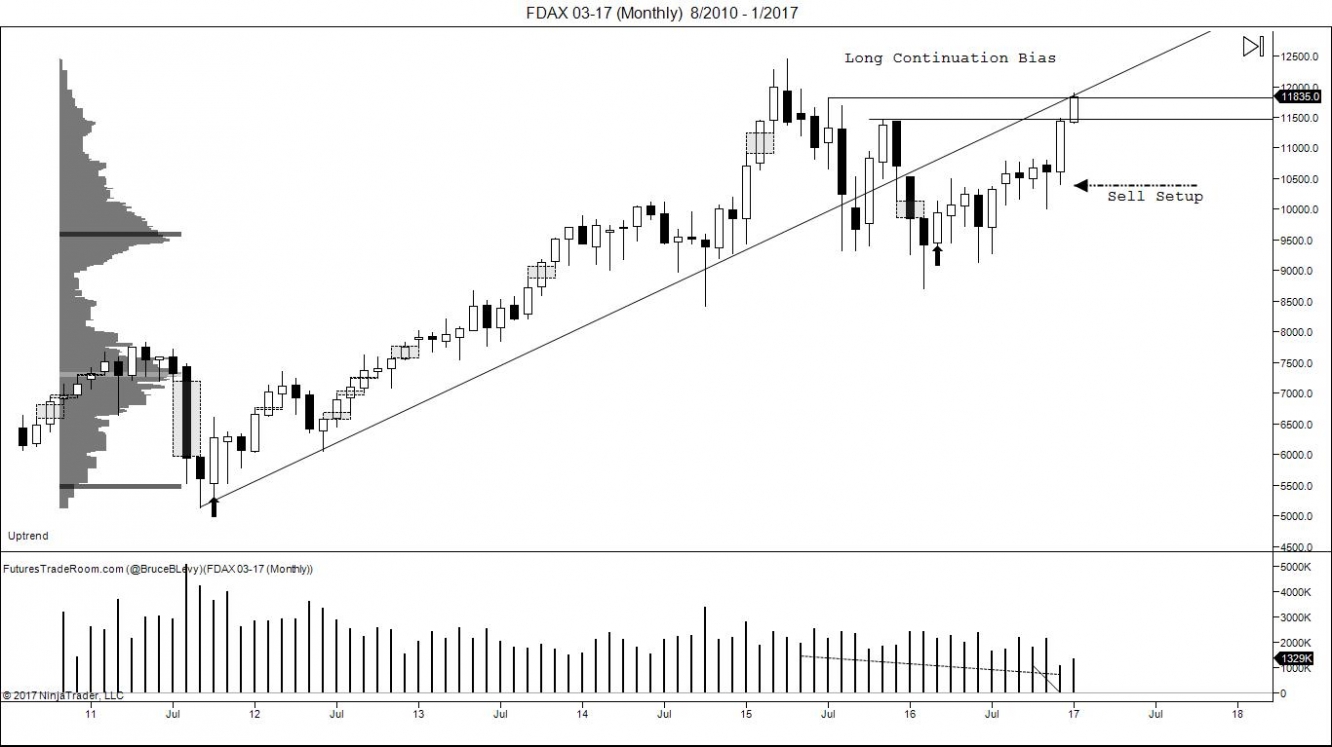
DAX 03-17 (Monthly) Under Bull Trendline
The FDAX is in an MTR Major Trend Reversal pattern. It is currently trading below the bull trendline but appears to have gained new strength. The sell setup area indicates where the bull may fail to breakout of the the MTR. We currently see the FDAX as bullish but will remain cautious as long as it is trading below the bull trendline.
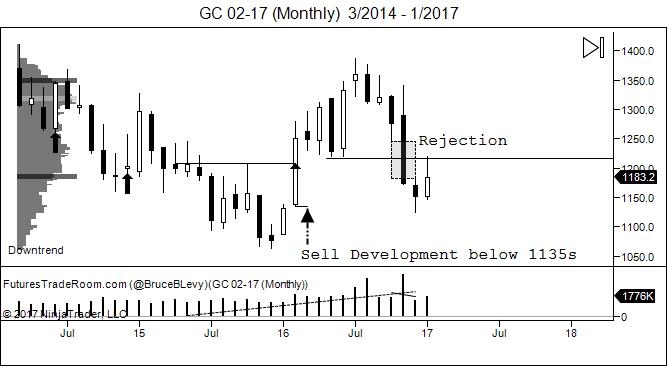
GC 02-17 (Monthly) Sell Setup in Progress
Gold will trigger a sell setup if it is able to develop below 1135s on the Daily charts. A Close below this level on the Monthly chart is a fair indication that a bear trend could continue for some time to come.
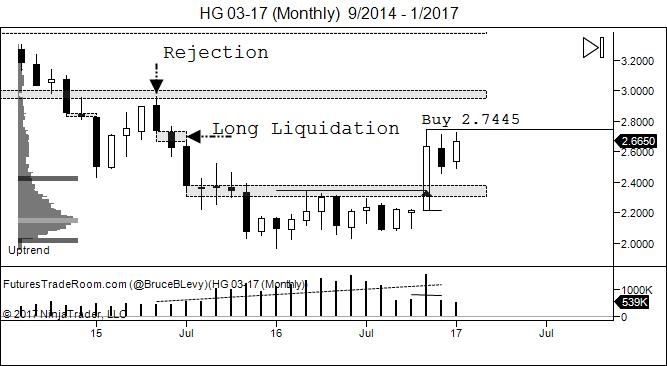
HG 03-17 (Monthly) Buy Setup
Copper is now trading above the 2016 trading range. A break above the November highs of 2.7445 could trigger a new long reentry opportunity.
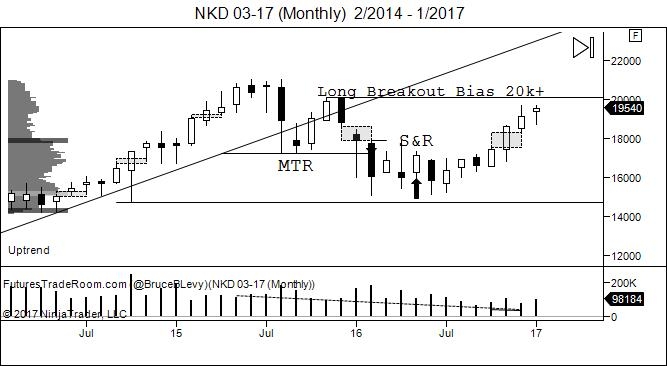
NKD 03-17 (Monthly) Approaching Breakout Level
The Nikkei 225 appears very similar to some of our MTR charts but has put in support near 15000. We gave a buy signal near 18000 in the weekly report but it appears that we could see a breakout to new highs on the NKD to reach the bull trendline at 22000.
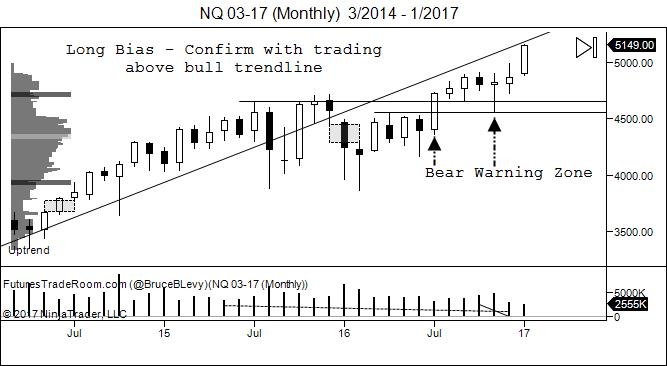
NQ 03-17 (Monthly) Under Bull Trendline
The NASDAQ has done it fair share of testing before reaching up to 5000. It is currently underneath the bull trendline so caution must be taken. A close above the bull trendline would confirm the upward bias.
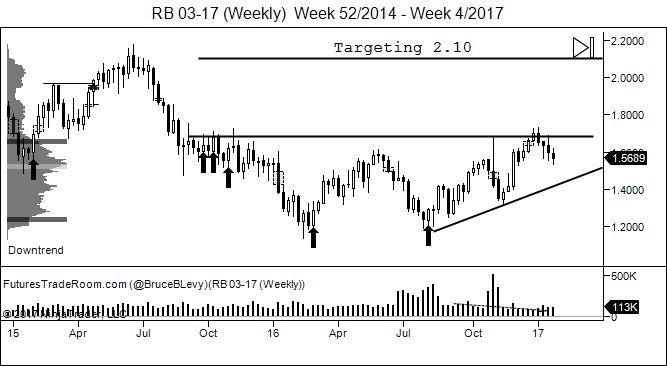
RB 03-17 (Weekly) Ascending Triangle
Gasoline RBOB has put in two mean reversion setups near 1.2000 which appear to be acting as accumulation zones. Since July it has put in higher lows. This Ascending Triangle has targets of 2.1000. The trigger will be a close above the near term highs.
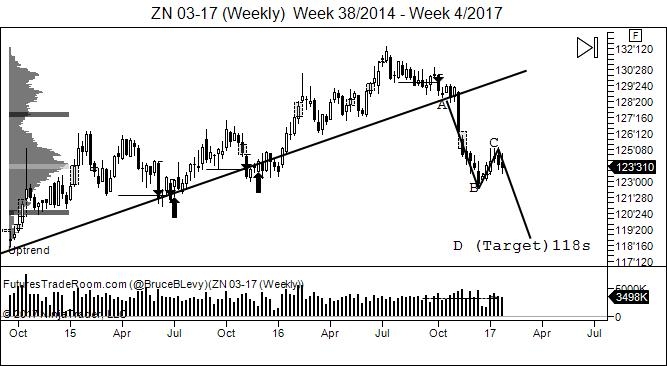
ZN 03-17 (Weekly) ABCD Sell Setup
The Zinc is currently in an MTR Major Trend Reversal. A penetration of the low at B could cause price to continue the downtrend towards 118.
