
Two days ago I started this mini-series of reviewing the seven most important stocks of the current market using Elliott Wave Theory: Facebook Inc (NASDAQ:FB), Apple (NASDAQ:AAPL), Netflix (NASDAQ:NFLX), Alphabet (NASDAQ:GOOGL), Microsoft (NASDAQ:MSFT), Amazon (NASDAQ:AMZN) and NVIDIA (NASDAQ:NVDA). Why? Because the first six names, excluding Netflix, make up about 20% of the S&P 500 and a whopping 40% of the NASDAQ Composite Index. And they’re all trading at or close to all-time highs (ATHs). I started with Apple, and yesterday, I reported on Microsoft.
The next one down on the market-cap totem pole is Amazon at $1.370 trillion. The largest online retailer and cloud software provider in the world. In this update, I wanted to compare its long-term price chart to
that of two other big household name stocks. Both have lost significant value recently, and have strikingly similar price patterns going into their blow-off phase: Boeing (NYSE:BA) and Walt Disney Company (NYSE:DIS).
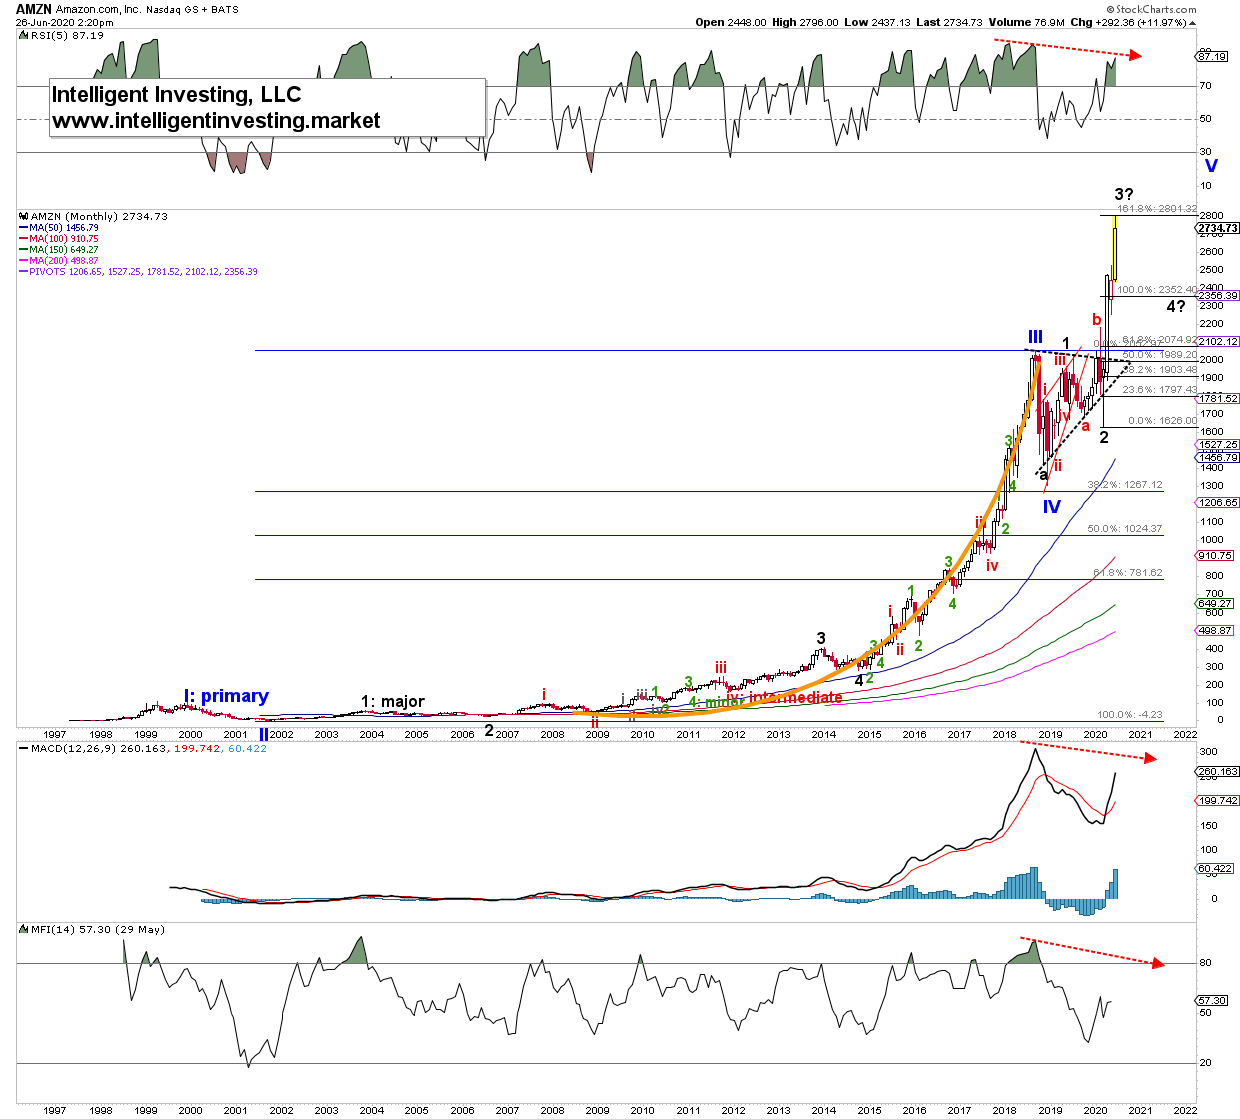
Amazon started trading in 1997, and like almost all tech stocks that were around back then, it peaked in 2000: blue wave-I. It bottomed in October 2001 at $5.51: blue wave-II. See Figure 1. Since then, it has
almost uninterruptedly rallied into its 2018 high of $2050.50 following a clean EWT impulse pattern (five waves up). A 370% increase (orang parabolic line). Since that high Amazon has been trading sideways
(triangular shaped) until March 23, 2020, low. Within that triangle, I can EWT count a wave-1 (leading diagonal) and a wave-2. Amazon has since that infamous low virtually gone straight up gaining just north of 70% in only three months. If the runup into 2018 wasn’t parabolic enough, then I can’t tell you what the current rally is. As you can see, this month’s price high reached the 1.618x Fibonacci-extension of wave-1, measured from wave-2 almost to the T ($2795 vs. $2801). This “straight-up” and Fib-extension is typical for a 3 rd wave. I, therefore, now expect a wave-4 retrace back to around the 100% extension ($2400 +/- 100) after which it should rally one final time for a wave-5 of V to new ATHs.
After that? I expect a 90% haircut. Call me crazy, but I will show two recent examples (there are many more) to make my case. But before I do that, please note the negative divergences building on the technical indicators, especially on the Money Flow Index. This mini-series shows, it is a recurring theme, most often foretelling of worse things to come.
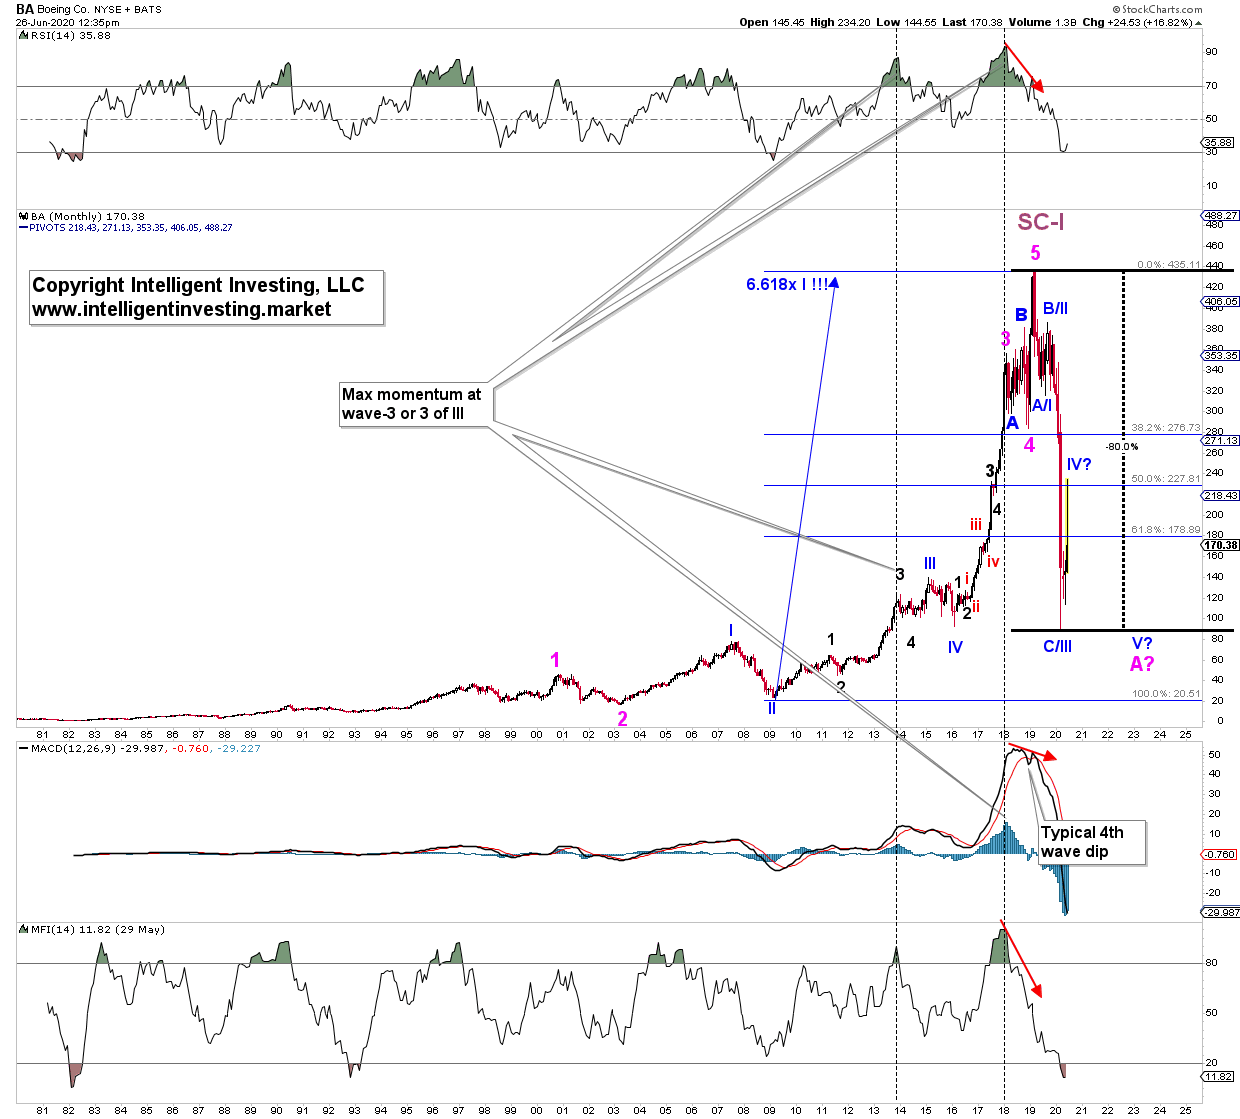
The monthly chart of Boeing shows a parabolic move from its 2016 low into its 2018 high. See figure 2. Similar to Amazon’s rise. It then traded sideways for almost a year, rallied for two months straight up, and
the rest is now history. Contrary to the technology stocks reviewed here, Boeing took a nosedive and lost 80% of its share price by late-March of this year. Note the negative divergences on the technical indicators (red arrows): less momentum and less money going into the stock during those last few months—the same as what is happening for Amazon now.
Figure 2.
Another stock that went parabolic, then temporarily sideways in a triangular fashion, followed by a blow-off top and significant drop is Disney. See Figure 3 below. The stock has been around for much longer
than most tech stocks, as it started trading publicly in 1946. Its long-term EWT count is, therefore, slightly different. But what matters is the similarities in price pattern and technical indicator setup between charts. Disney went parabolic from 2009 into 2015: an almost 900% gain. It went sideways, in a triangle, for nearly three years, which I count as a (blue) Primary-IV wave. 4 th waves are often triangles.
From the April 2018 low, I can then count five (black) waves up into the November 2019 high. The 3 rd wave subdivided nicely into five smaller waves (red i, ii, iii, iv, v). Disney followed a picture-perfect EWT
impulse pattern. Once the impulse completed at $152.50, Disney went on to lose 48% come end-of-March 2020. No surprise either since the technical indicators were, once again, diverging: higher prices on less momentum and less money flowing into the stock. Disney has since the March low rebounded (which stock hasn’t?), but it is in a three-wave fashion: corrective. I, therefore, expect more downside shortly.
Figure 3.
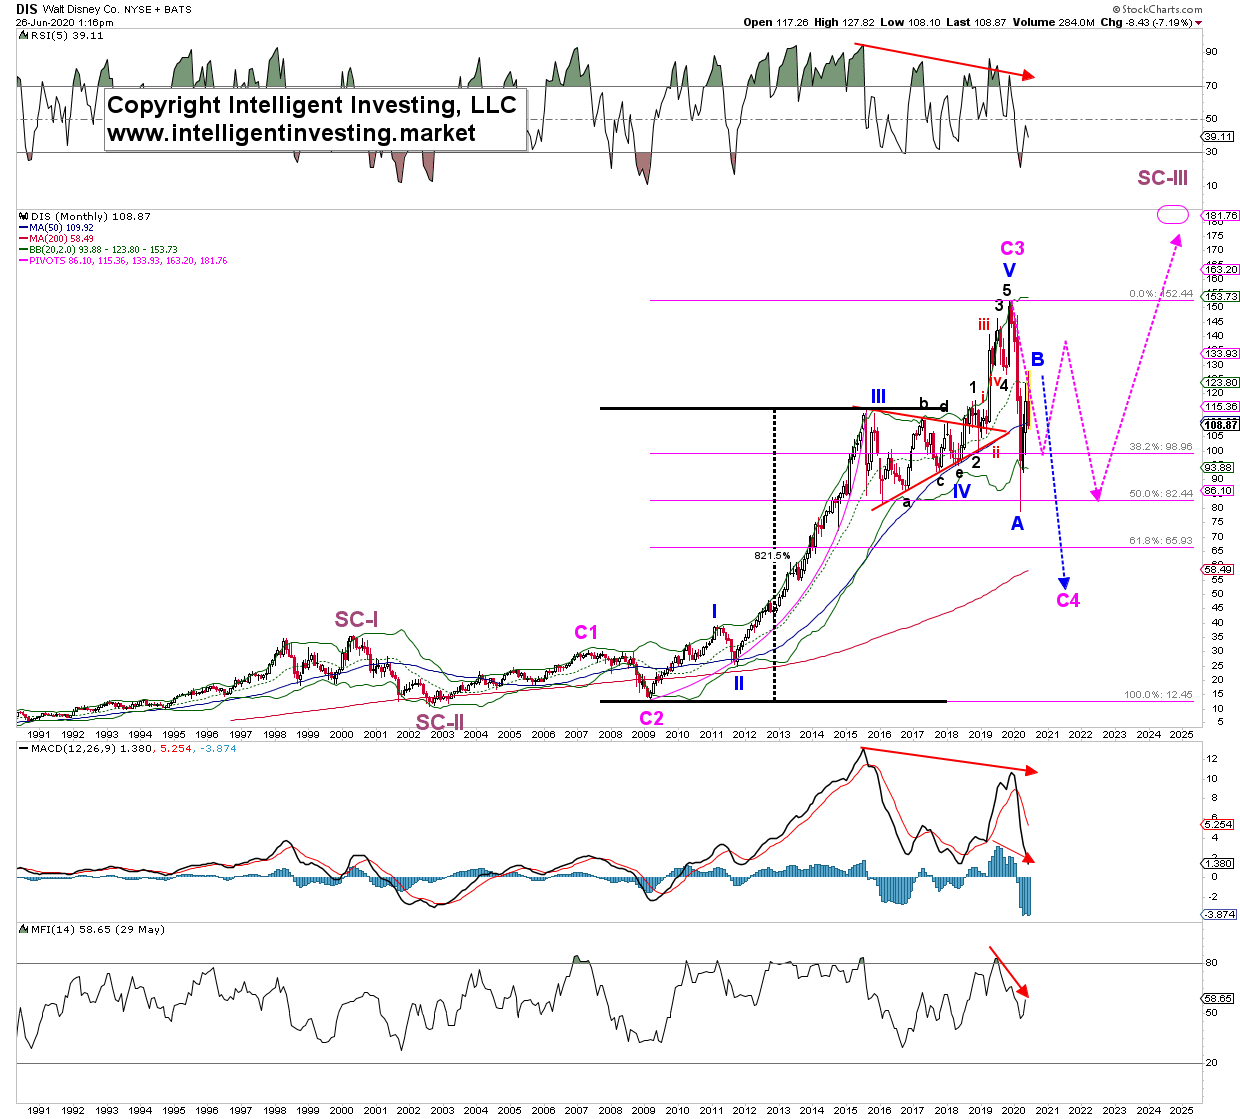
The purple dotted arrows are the path I projected in January 2020 for Disney. What the market did came close. This pattern recognition is the predictive power of Elliott Wave. But, bringing this back to the
current Amazon chart, and I find striking similarities with Boeing and Disney before their bubble burst:
– Parabolic runup, equivalent to a 3 rd wave
– Many months of sideways price action, often in the form of a triangle, aka consolidation. Equivalent to a 4 th wave.
– A break out from the consolidation level. This rally lasts several months: around 2 to 24—the final 5 th wave.
– The breakout is on slowing momentum and less money flow.
The result of this pattern is always the same: lots of pain. For now, it appears Amazon is where Disney was either April or July 2019. Maximum upside potential for Disney was then 5-15%, and downside risk well over 40%. These are repeating universal patterns that most, if not all, stocks will succumb to eventually.
Need more proof?
Take a look at, for example, Ford Motor Company (NYSE:F), Bank of America Corp (NYSE:BAC) and General Electric Company (NYSE:GE). Please tell me how each did after there parabolic phase. Has any traded above their ATHs, or are they treading water with no net gains over several decades?
Using Elliott wave, similarities in price patterns, and comparing technical indicator setups, I find Amazon is likely closer to a significant top than to a bottom. From other stock examples, it is evident once stocks
have gone parabolic, their long-term performance is less than stellar. Each share will trade differently after the blow-off top, but haircuts of 90% are more likely than not.