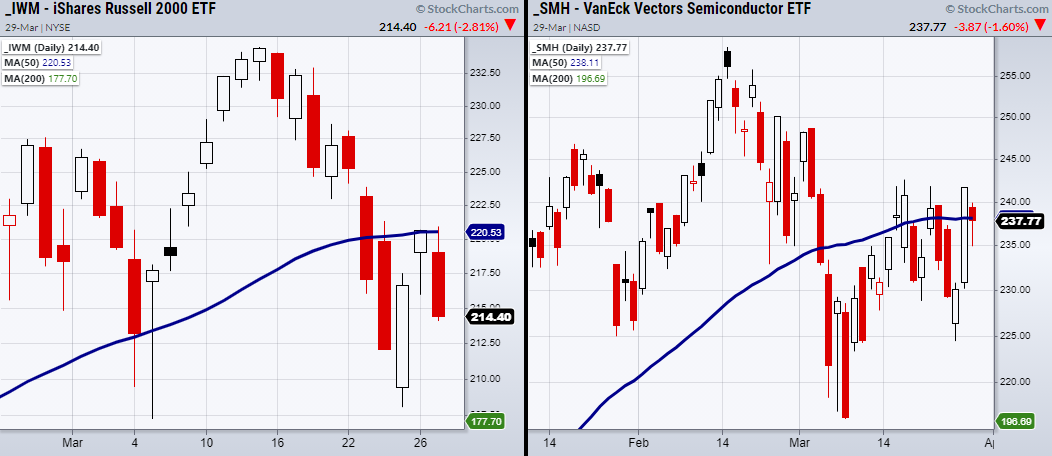
Last Friday the Russell 2000 IWM index and Semiconductors SMH cleared their 50-Day moving average. From a technical standpoint this looked as though the rally would continue into Monday. At least that is what traders/investors were hoping for when they bought near Friday's close.
Monday’s price action turned out quite different.

So, was it wrong for people to expect the market to open higher Monday? Not necessarily. Although we all trade with the expectation to make money, we must strategize with the expectation of losing money. In other words, it is necessary to have a risk plan for every trade you take and position size accordingly.
For instance, if someone had taken a trade based off IWM clearing its 50-DMA and come Monday the market gapped below, then it is easy to see what they expected was wrong. Therefore trading off of phase changes is best when you have a second day confirmation.
Because IWM did not close a second time over the 50-DMA gives bulls two choices. Watch for IWM to make a second attempt to clear its 50-DMA or set a stop loss at the nearest support level. Our advice is to have a stop loss under the Mar. 5 low at 207.21. And if you traded the phase change tighter with a stop under Friday’s low, or if IWM failed to hold the 50-DMA, you planned for that well and are now in cash on that position.
Now, with a clear head you can start again looking for a new entry. This might sound simple, but this is helpful when actively trading. Often, people do not completely know when they are wrong or plan for when they are wrong, which can lead to much larger losses.
By keeping clear expectations of why you entered a trade, you will have an easier time following your trade plan. Then, if the market does not follow through immediately, you already planned for that and hopefully, gave the trade enough room to sit through it.
ETF Summary
- S&P 500 (SPY) Support 386.87. 398.12 Resistance.
- Russell 2000 (IWM) Failed second close over 50-DMA at 220.53. Watching for another attempt over 50-DMA.
- Dow (DIA) 332.86 high to clear.
- NASDAQ (QQQ) Needs to stay over 309, 321 resistance and key.
- KRE (Regional Banks) Support 50-DMA at 63.27
- SMH (Semiconductors) 238 pivotal.
- IYT (Transportation) Holding near highs.
- IBB (Biotechnology) Main support the 200-DMA at 144.87.
- XRT (Retail) Like to see this hold over 85.69.
- Volatility Index (VXX) Having a Doji day.
- Junk Bonds (JNK) Watching for second close over the 50-DMA at 108.60.
- LQD (iShares iBoxx $ Investment Grade Corp Bond ETF) 130.06 gap to fill. Needs to hold 128.93.
- IYR (Real Estate) Holding near highs. Doji Day.
- XLU (Utilities) Watch for this to clear and hold over 64.19.
- GLD (Gold Trust) 159.35 next support level.
- SLV (Silver) Closed over 22.82 the 200-DMA.
- VBK (Small Cap Growth ETF) 259.62 support.
- UGA (US Gas Fund) Cleared the 10-DMA at 31.63.
- TLT (iShares 20+ Year Treasuries) Pivotal area with 135.80 the 50-WMA.
- USD (Dollar) Support 92.53 the 200-WMA.
- EWW (Mexico) 44.91 resistance.
- MJ (Alternative Harvest ETF) 22.85 the 50-DMA.
- WEAT (Teucrium Wheat Fund) Needs to get back over 6.
