It’s disconcerting when the exchange traded fund (ETF) you’re interested in has low trading volumes. Days can go by with no volume at all. If it was a small cap stock you wouldn’t consider buying it. But low volume in itself shouldn’t prevent you from considering an ETF— some have the liquidity of a large-cap stock.
ETF Liquidity
Unlike stocks, ETFs have two levels of liquidity. The first level is the same as a stock—the pool of people / institutions that hold, or are short the security. The second level of liquidity is the domain of institutions. They monitor the difference between the ETF’s trading price and the price of the underlying securities. If that gap gets big enough they will buy or sell the ETF as appropriate and trade an offsetting transaction in the underlying.
For example, let’s say there was a low volume ETF that tracks Apple (NASDAQ:AAPL), Amazon (NASDAQ:AMZN), and Google (NASDAQ:GOOGL)—I’ll call it AAG, which holds one third of its assets in each stock and re-balances at the end of each day. During the day you’d expect AAG’s intraday value to be the market prices of AAPL, AMZN, and GOOG times the number shares it’s holding in each.
But what if AAG is trading lower than its asset value? If you can buy AAG at 55.03, and it has 200,000 shares outstanding the market is valuing the fund at $11,006,000, but what if you could sell AAG’s stock holdings for $11,050,000 –a 0.5% premium?
The second tier liquidity providers know exactly what to do; they buy undervalued shares of AGG, and short the appropriate number of Apple, Amazon, and (Google) shares to lock in their profit. At day’s end they go to AAG’s issuer and sell back (redeem) the AAG shares they bought in exchange for shares of AAPL, AMZN, and GOOG. These ratios are fixed for the day so they get exactly the number of shares they need to cover their short positions. They’ve just made 0.5% on their invested capital with zero risk. It doesn’t matter what happens to AAG, AAPL, AMZN, and GOOG’s prices after their trade executions — their position is perfectly hedged. This is an example of riskless arbitrage.
So how do the transactions of the 2nd tier providers (called authorized participants, or APs) impact AAG’s price? Well, if AAG is underpriced they are buying it, driving up the price, and if it is overpriced they are selling AAG—exactly the actions that are needed to bring AAG’s value closer to its ideal level. Because these transactions are riskless to the APs they are happy to continue them until the price difference between the market and the ideal level becomes too small to be profitable given transaction costs, bid/ask spreads, etc.
In the case of AAG the liquidity provided by the APs makes AAG no riskier for the investor than owning Apple, Amazon, and Google. You can buy or sell large quantities of AAG without impacting its price.
If the underlying securities of an ETF are liquid then the ETF itself will be liquid too.
On the other hand, the liquidity picture for an ETF that tracks small cap Chinese stocks (e.g., ECNS) is significantly different. The underlying stocks aren’t even trading when the USA markets are open because there’s no overlap in trading hours with the Chinese exchanges. Now instead of riskless arbitrage the 2nd tier liquidity providers take significant risks if they buy or sell ECNS shares. They will do these transactions, but not without requiring a significant premium to sell you shares or a discount in buying shares from you.
What About Exchange Traded Notes?
Although the term ETF is used generically to reference all exchange traded products, a subset of funds called exchange traded notes (ETNs) handle things differently than the example above. While ETFs explicitly hold the securities specified in the index they track, ETNs link to their index without revealing how they hedge their exposure to market moves. In practice ETN issuers do hedge their positions, but usually with derivatives like swaps or options that are less expensive than the actual underlying securities.
When an ETN’s shares are redeemed, issuers pay out cash according to the net asset value (NAV) per share, rather than exchanging securities. If the AAG example above was an ETN the Authorized Participant would cover their short positions themselves by buying Apple, Amazon, and Google shares at day end rather than obtaining the offsetting securities from the issuer. If the underlying securities are liquid the arbitrage transactions by 2nd tier liquidity providers are just as effective for ETNs as they are for ETFs.
Evaluating Market Depth
As a liquidity cross-check for ETFs and ETNs you can look at their Level 2 market depth. These reports tell you not only how many shares are being offered at the National Best Bid and Offer (NBBO) quotes, but also can give you an indication of how much additional liquidity is available if you are willing to pay a premium on a buy or accept a discount on a sale.
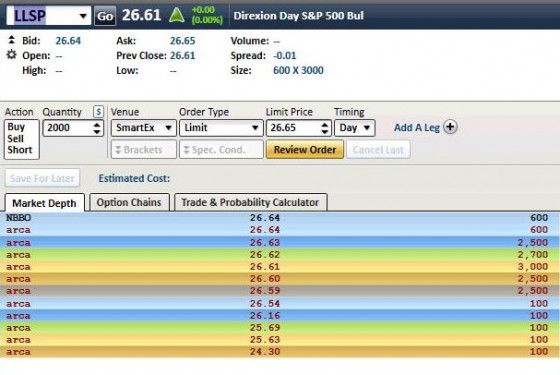
The Level 2 Schwab StreetSmart Pro screen shot below of market depth is for Direxion Daily S&P 500 Bull 1.25X Shares (NYSE:LLSP), an ETF with low daily volume. Its underlying is the S&P 500— probably the most liquid security in the world.

The numbers on the far right indicate the number of shares various market participants are willing to sell at the prices listed in the middle. The share amounts shown are minimum amounts—other players like high frequency traders (HFT) and dark pools will likely jump in with additional liquidity if a buyer appears. The top two depth lines are essentially a duplicate, showing that the quote provided by the “arca” exchange is the current overall best bid.
A market order to sell 1000 shares would likely sell 600 shares at 26.64 and the remaining 400 at 26.63—a mere 0.04% less than the initial bid value.
A limit order to sell 1000 shares would probably fill entirely at 26.64 within a few minutes.
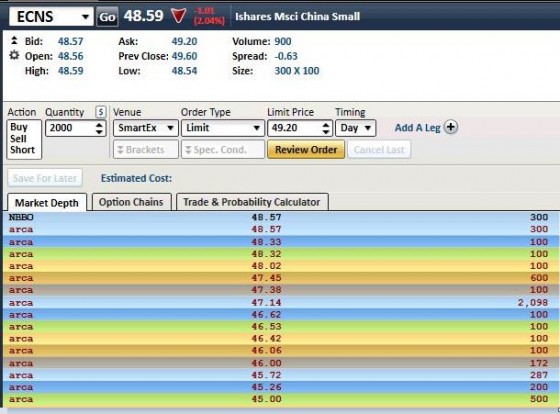
The next screenshot shows the level 2 quotes for another low volume ETF— iShares MSCI China Small-Cap (NYSE:ECNS). It does not have good liquidity even though it holds more than 20X the assets of LLSP.

A market order (not recommended!) to sell 1000 shares of ECNS would likely clear the book down to the 47.45 level—a big 2.3% drop from the starting bid price of 48.57. A limit order at 48.57 would enable you to sell at least 300 shares at that price, but there is a good chance the rest of order would not fill because the next official bids are 0.5% lower. The illiquidity of the underlying stocks makes it unprofitable for the tier 2 liquidity providers to offer better prices.
Some Investigation Required
Unlike a small cap stock you can’t judge the liquidity of an ETF or ETN by its daily volume or assets under management. A quick look at the securities underlying the fund will spell out the real liquidity story—it’s dumb to use small cap rules of thumb.
