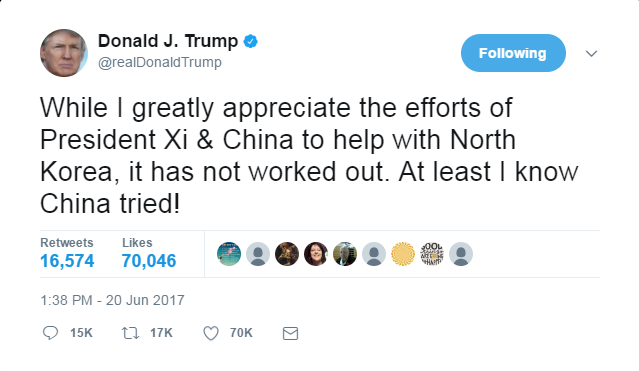
I have always said that I am not smarter than you, that I received my education at the ‘school of hard knocks’ on the trading floors of the Chicago Board of Trade and the Chicago Mercantile Exchange. Many people depend on me for my street smarts and my feel for the markets. I consider myself a futures tape reader. With that said, I have had a very, very bad feeling for what’s going on in the Middle East and North Korea, and I have expressed my concerns to the PitBull many times. Last night President Trump used Twitter to voice his concern about North Korea.
Below are the actual Tweets. While I may be jumping the gun, I think things are heading to a boiling point. No one wants a war, there are too many lives at risk, and South Korea is one of the most densely populated areas in the world. #LivesMatter

Quick Recap
The S&P 500 futures (ESU17:CME) traded up to 2451.00 on Globex at 8:45 PM and then sold off down to 2444.75 around 7:45 AM CT. On the 8:30 ct futures open the (ESU17:CME) traded 2446.25, and then got hit by several sell programs that pushed the future down to an early low at 2441.25.
Oil was weak again, trading down to the 43.03 level, and popped up a little as news came out that the U.S. had shot down an Iranian drone. Crude oil futures also expired yesterday, which only added to the volatility. After the pop crude oil (CLU17:NYMEX) traded back down to a new low at 42.94, made several higher lows, then traded up to 43.27.
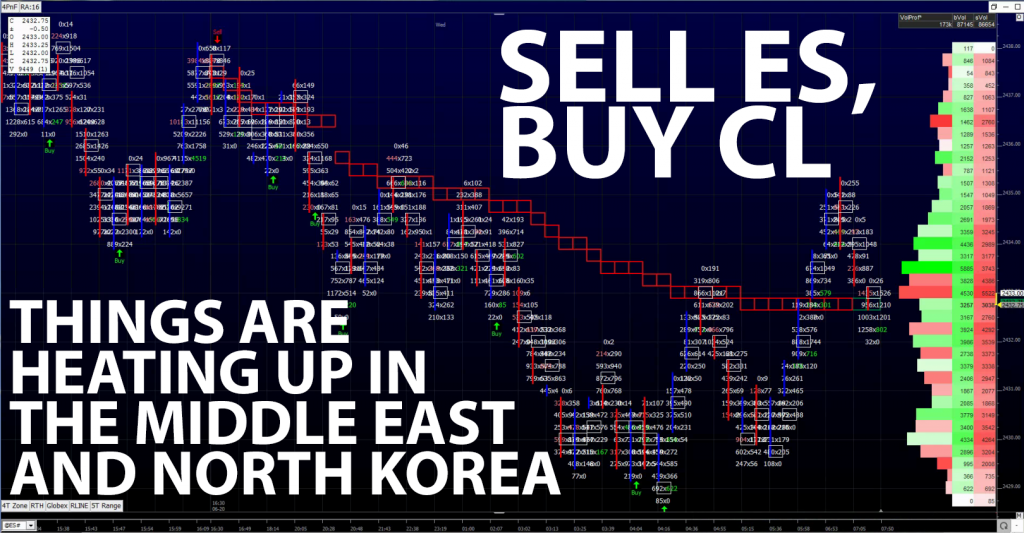
After a pop back up to above the vwap at 2445.50 the ES sold back off to the low and double bottomed at 2441.00. It looked like there was a buy CL / sell ES trade going on. The next move in the ES was down to 2437.25 and then back up to 2442.57, while at the same time crude oil traded up to 43.38, backed off to 43.17, and then popped back up to 43.37. To tell the truth neither, market acts all that great.
Sell ES / Buy CL
Around 1:00pm, crude oil (CLQ17:NYMEX) started to pop and traded up to 43.46, and then up to the vwap at 43.62 before starting to down tick. After a small pull back, the ES traded back to 2442.75 and started to pull back again. Other than the early sell off down to 2437.25 at 11:30, the ES had been stuck in a 3 handle range for 2 hours. The ES finally broke out of the 3 hande range and traded down to 2437.75, 2 ticks off the low of the day, around 1:45. It was a game of ES/ CL ping pong all day.
Later on, the ES retested the 2437.75 level, and CL down ticked to 43.39. The MIM opened up showing $300 mil to sell. The ES pushed down to new lows at 2434.75 just as a headline came out saying that the Brussels train station had been evacuated. The 2:45 cash imbalance showed Sell $586 million, and the ES made a new low at 2434.00. Late in the day the CLQ traded up and down between 43.39 and 43.53.
In the end, the weak stats seemed to catch up with the ES yesterday, but I’m not sure that it wasn’t just a normal pull back after a new all-time high. Volume was only 1.14 million just before the 3:00 cash close. The (ESU17:CME) closed down 11 handles at 2436.50, or -0.45%, the Dow Jones futures (YMU17:CBT) closed down 22 points at 21439.00, or -0.10 %, the Nasdaq 100 futures (NQU17:CME) closed down 33.5 points at 5732.50, or -0.58%, and crude oil (CLQ17:NYMEX) settled at 43.48, down 93 cents, or -2.12%.
While You Were Sleeping
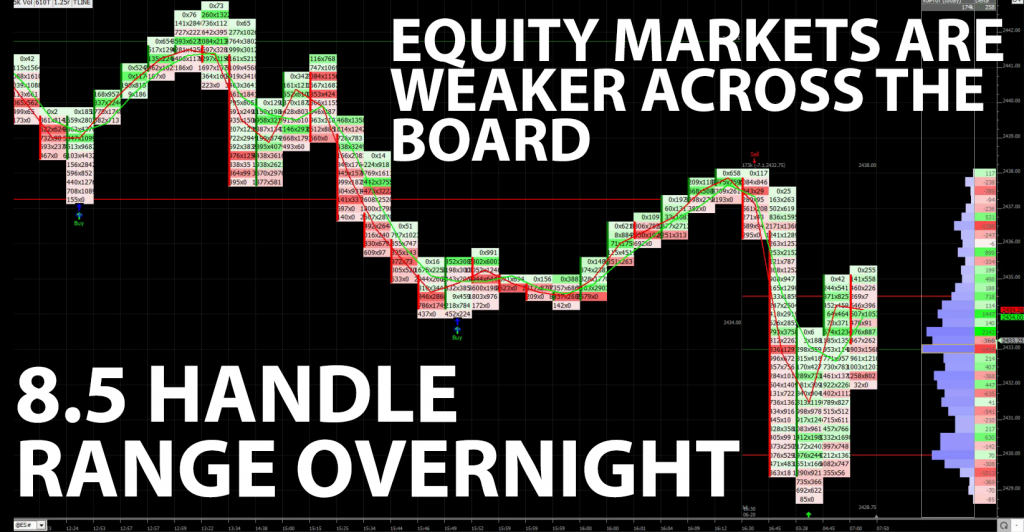
Overnight, equity markets in Asia closed weak, and all majors in Europe are currently trading lower this morning. In the U.S., the S&P 500 futures opened the globex session at 2435.75, and found the high at 2437.25 just after 7:00pm CT. From there, the ES traded lower, fueled by the weakness in Asia, and printed an early low of 2432.50 at 7:30pm. After that, the futures drifted sideways until the European open, when another wave of selling came in, pulling the futures down to a new low of 2428.75 at 3:20am. Since then, the ES has found some support, and pushed back up to 2435.25. As of 6:25am CT, the last print in the ESU is 2432.50, down -5 handles, with 160k contracts traded.
In Asia, 8 out of 11 markets closed lower (Shanghai +0.52%), and in Europe 12 out of 12 markets are trading lower this morning (FTSE -0.26%). Today’s economic calendar includes the Bank Reserve Settlement, MBA Mortgage Applications, Existing Home Sales, and the EIA Petroleum Status Report.
Our View
Well, the MrTopStep rule that the ES tends to go sideways to lower after a big up day was right on. Sure you could have bought a few of the breaks, but the money trade was being a seller. The weak stats seemed to catch up yesterday, but I’m not sure that it wasn’t just a normal pull back after a new all-time high.
PitBull: clq osc -18/-22 turns down on a close below 4429 esu osc 7/15 turns down on a close below 242856 vix osc turns up on a close above 1064
